2020 Presidential Elections Analysis
Cassidy Bargell
View the Project on GitHub cassidybargell/election_analytics
Home
Post Election Reflection
11/25/20
How My Model Performed
My final prediction model was a weighted ensemble that combined generalized linear models based off of data from polls, demographics, unemployment rates, and COVID-19 deaths. I settled on using weights for each state that were inversely proportionate to the RMSE of each individual model in the weighted ensemble. This meant for the majority of states the COVID-19 7-day death rate model was weighted most heavily, and the unemployment model was given the least amount of weight.
Predicted Incumbent Vote Share = (pwt * Poll-Model) + (ewt * Unemploy-Model) + (dwt * Demographic-Model) + (cwt * COVID-Model)
Where pwt, ewt, dwt, and cwt are weights assigned to each model. The heavier a model is weighted, the more influence it has over the final prediction produced by the model.
The final point estimate this model produced was 368 electoral college votes to Biden and 170 to Trump.
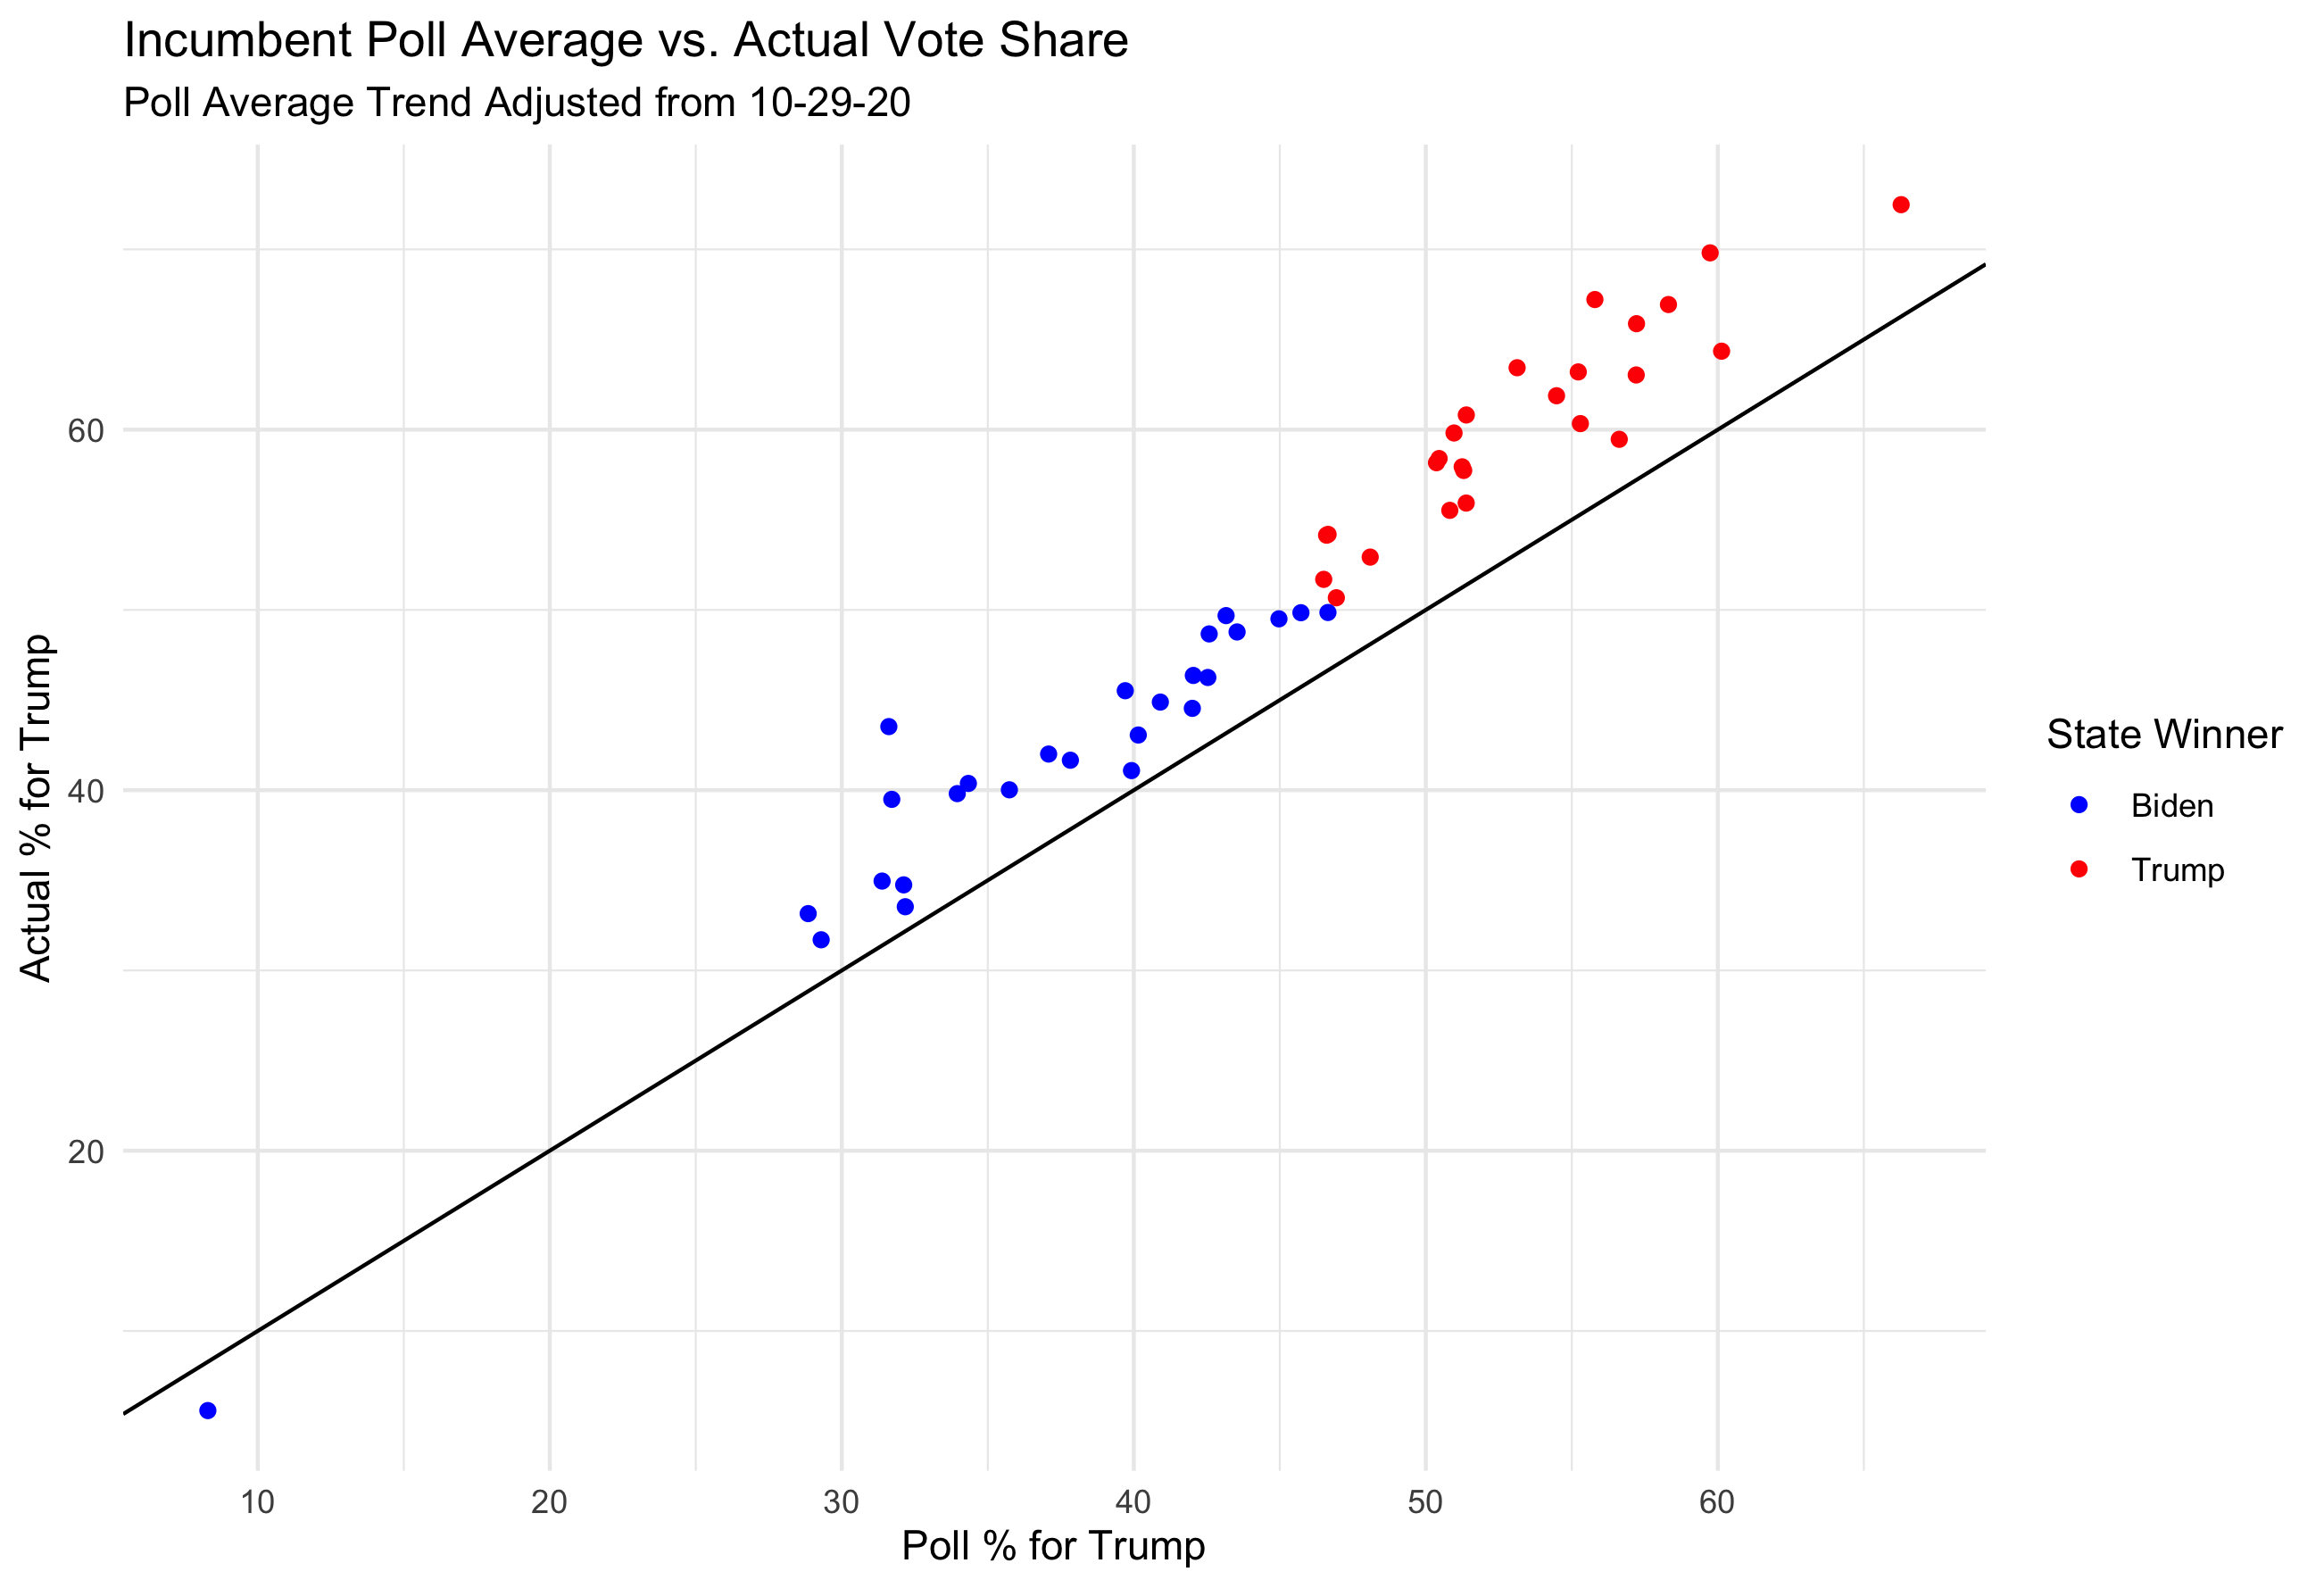
The final election outcome was 306 electoral college votes for Biden and 232 for Trump. I overpredicted Biden’s win by 62 electoral college votes, which comes down to missing three states that went to Trump: Florida (29 votes), Ohio (18 votes), and North Carolina (15 votes). (I also predicted Maine and Nebraska without split votes, but both states had one vote go to the non-majority party which was one for Biden in Nebraska and one for Trump in Maine, so it had no final effect on the overall electoral vote count.)
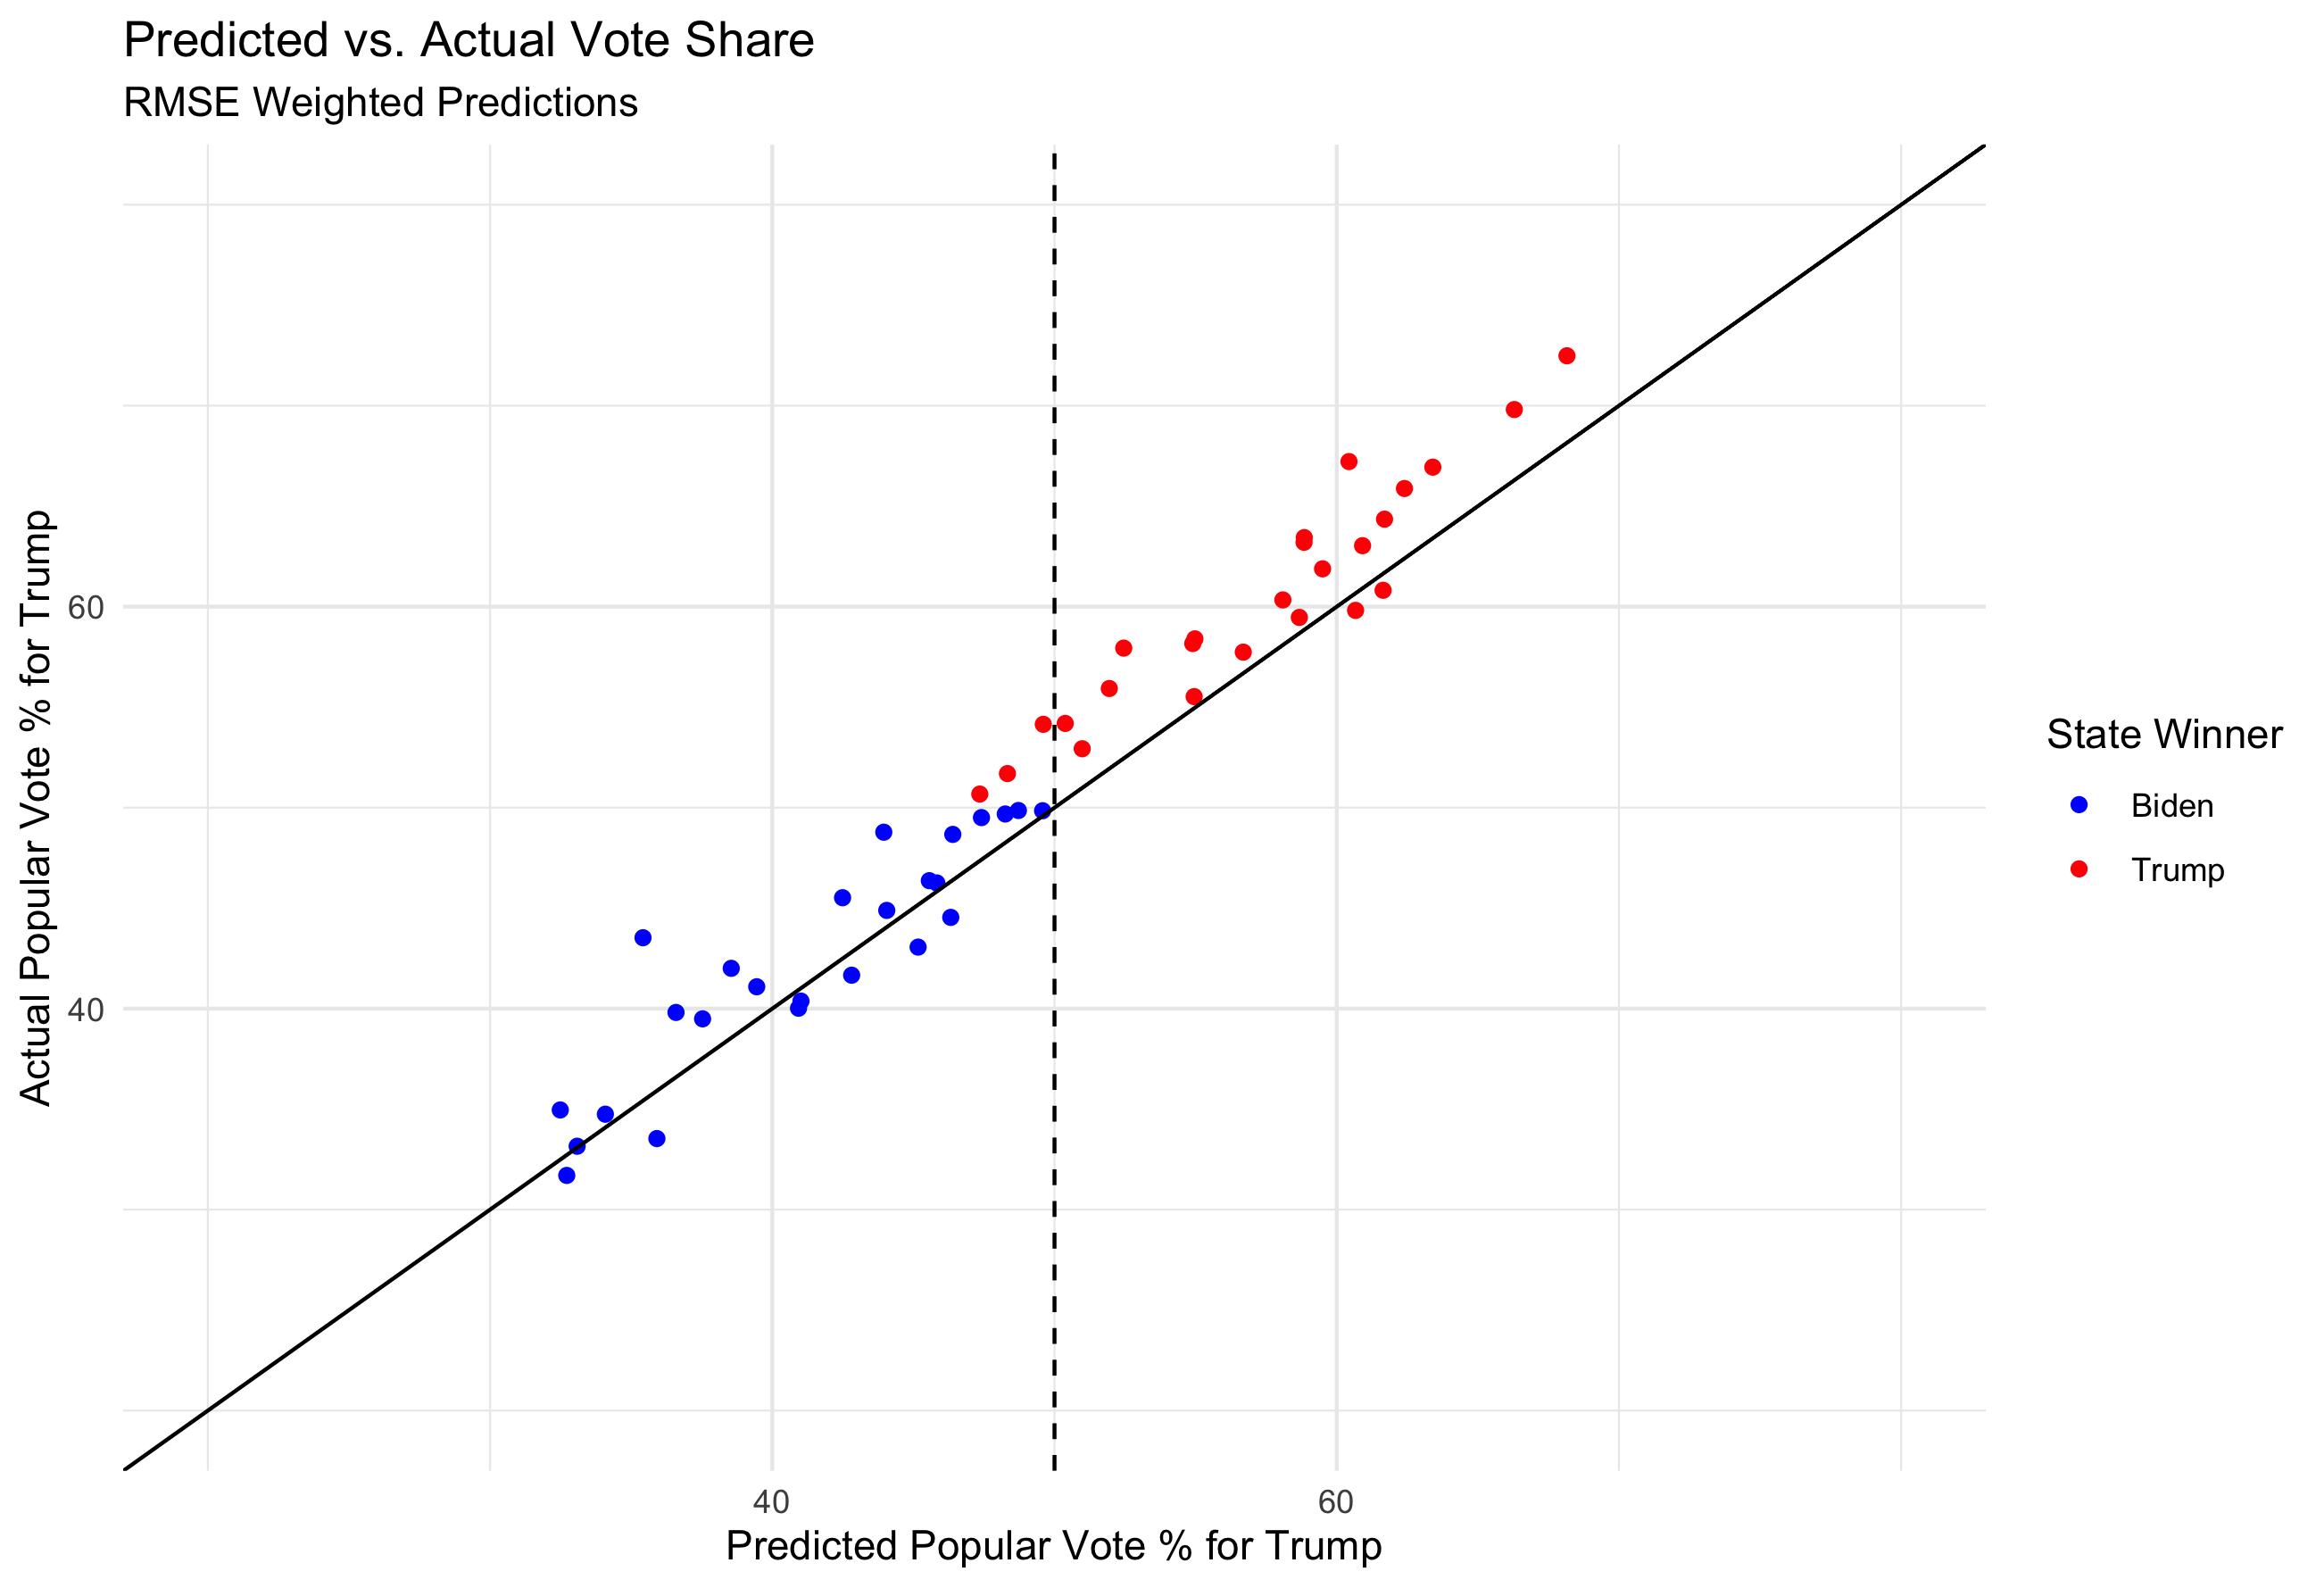
(The three states I missed are the three red points to the left of the vertical line)
States above the diagonal line are states in which I overpredicted the Biden vote share, and states under the diagonal line are where I underpredicted Biden vote share. Overall I overpredicted Biden in 41 out of 50 states, the nine states in which I overpredicted Trump vote share were Maryland, Colorado, New Mexico, Oregon, Vermont, Washington, Nebraska, Utah, and Delaware.
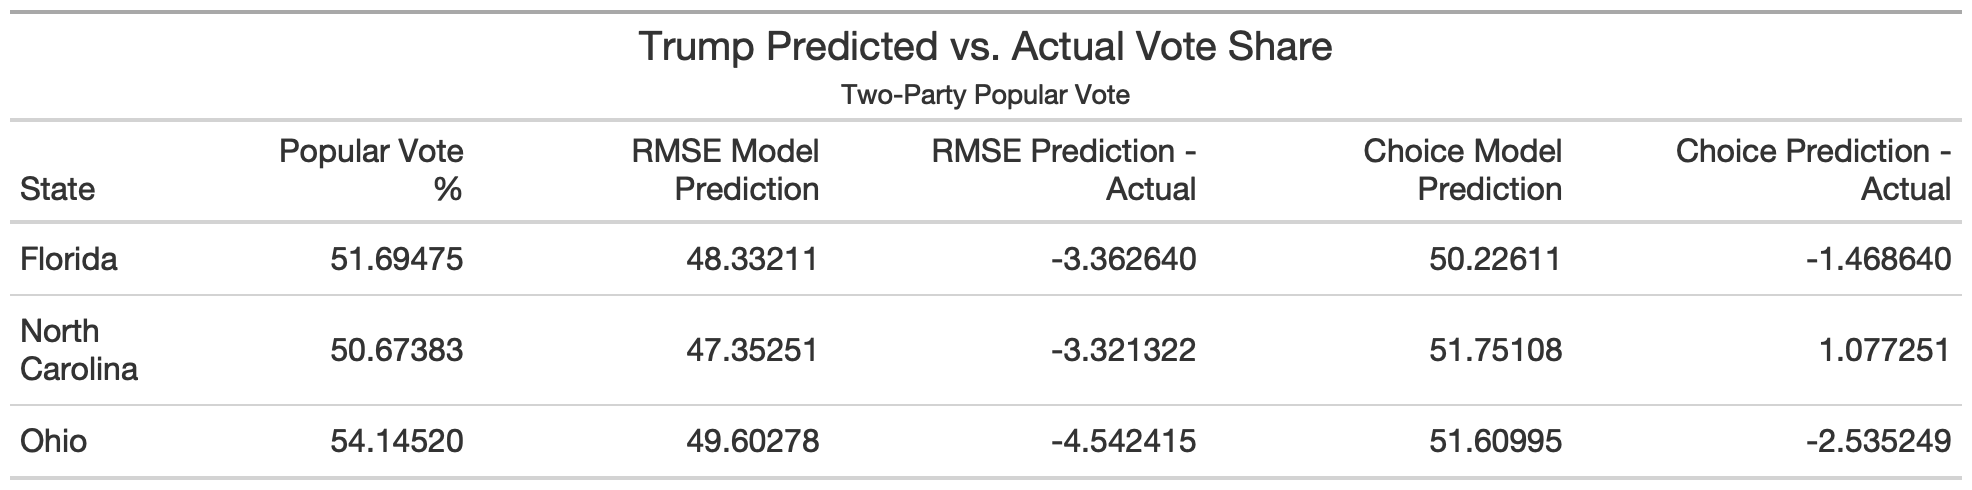
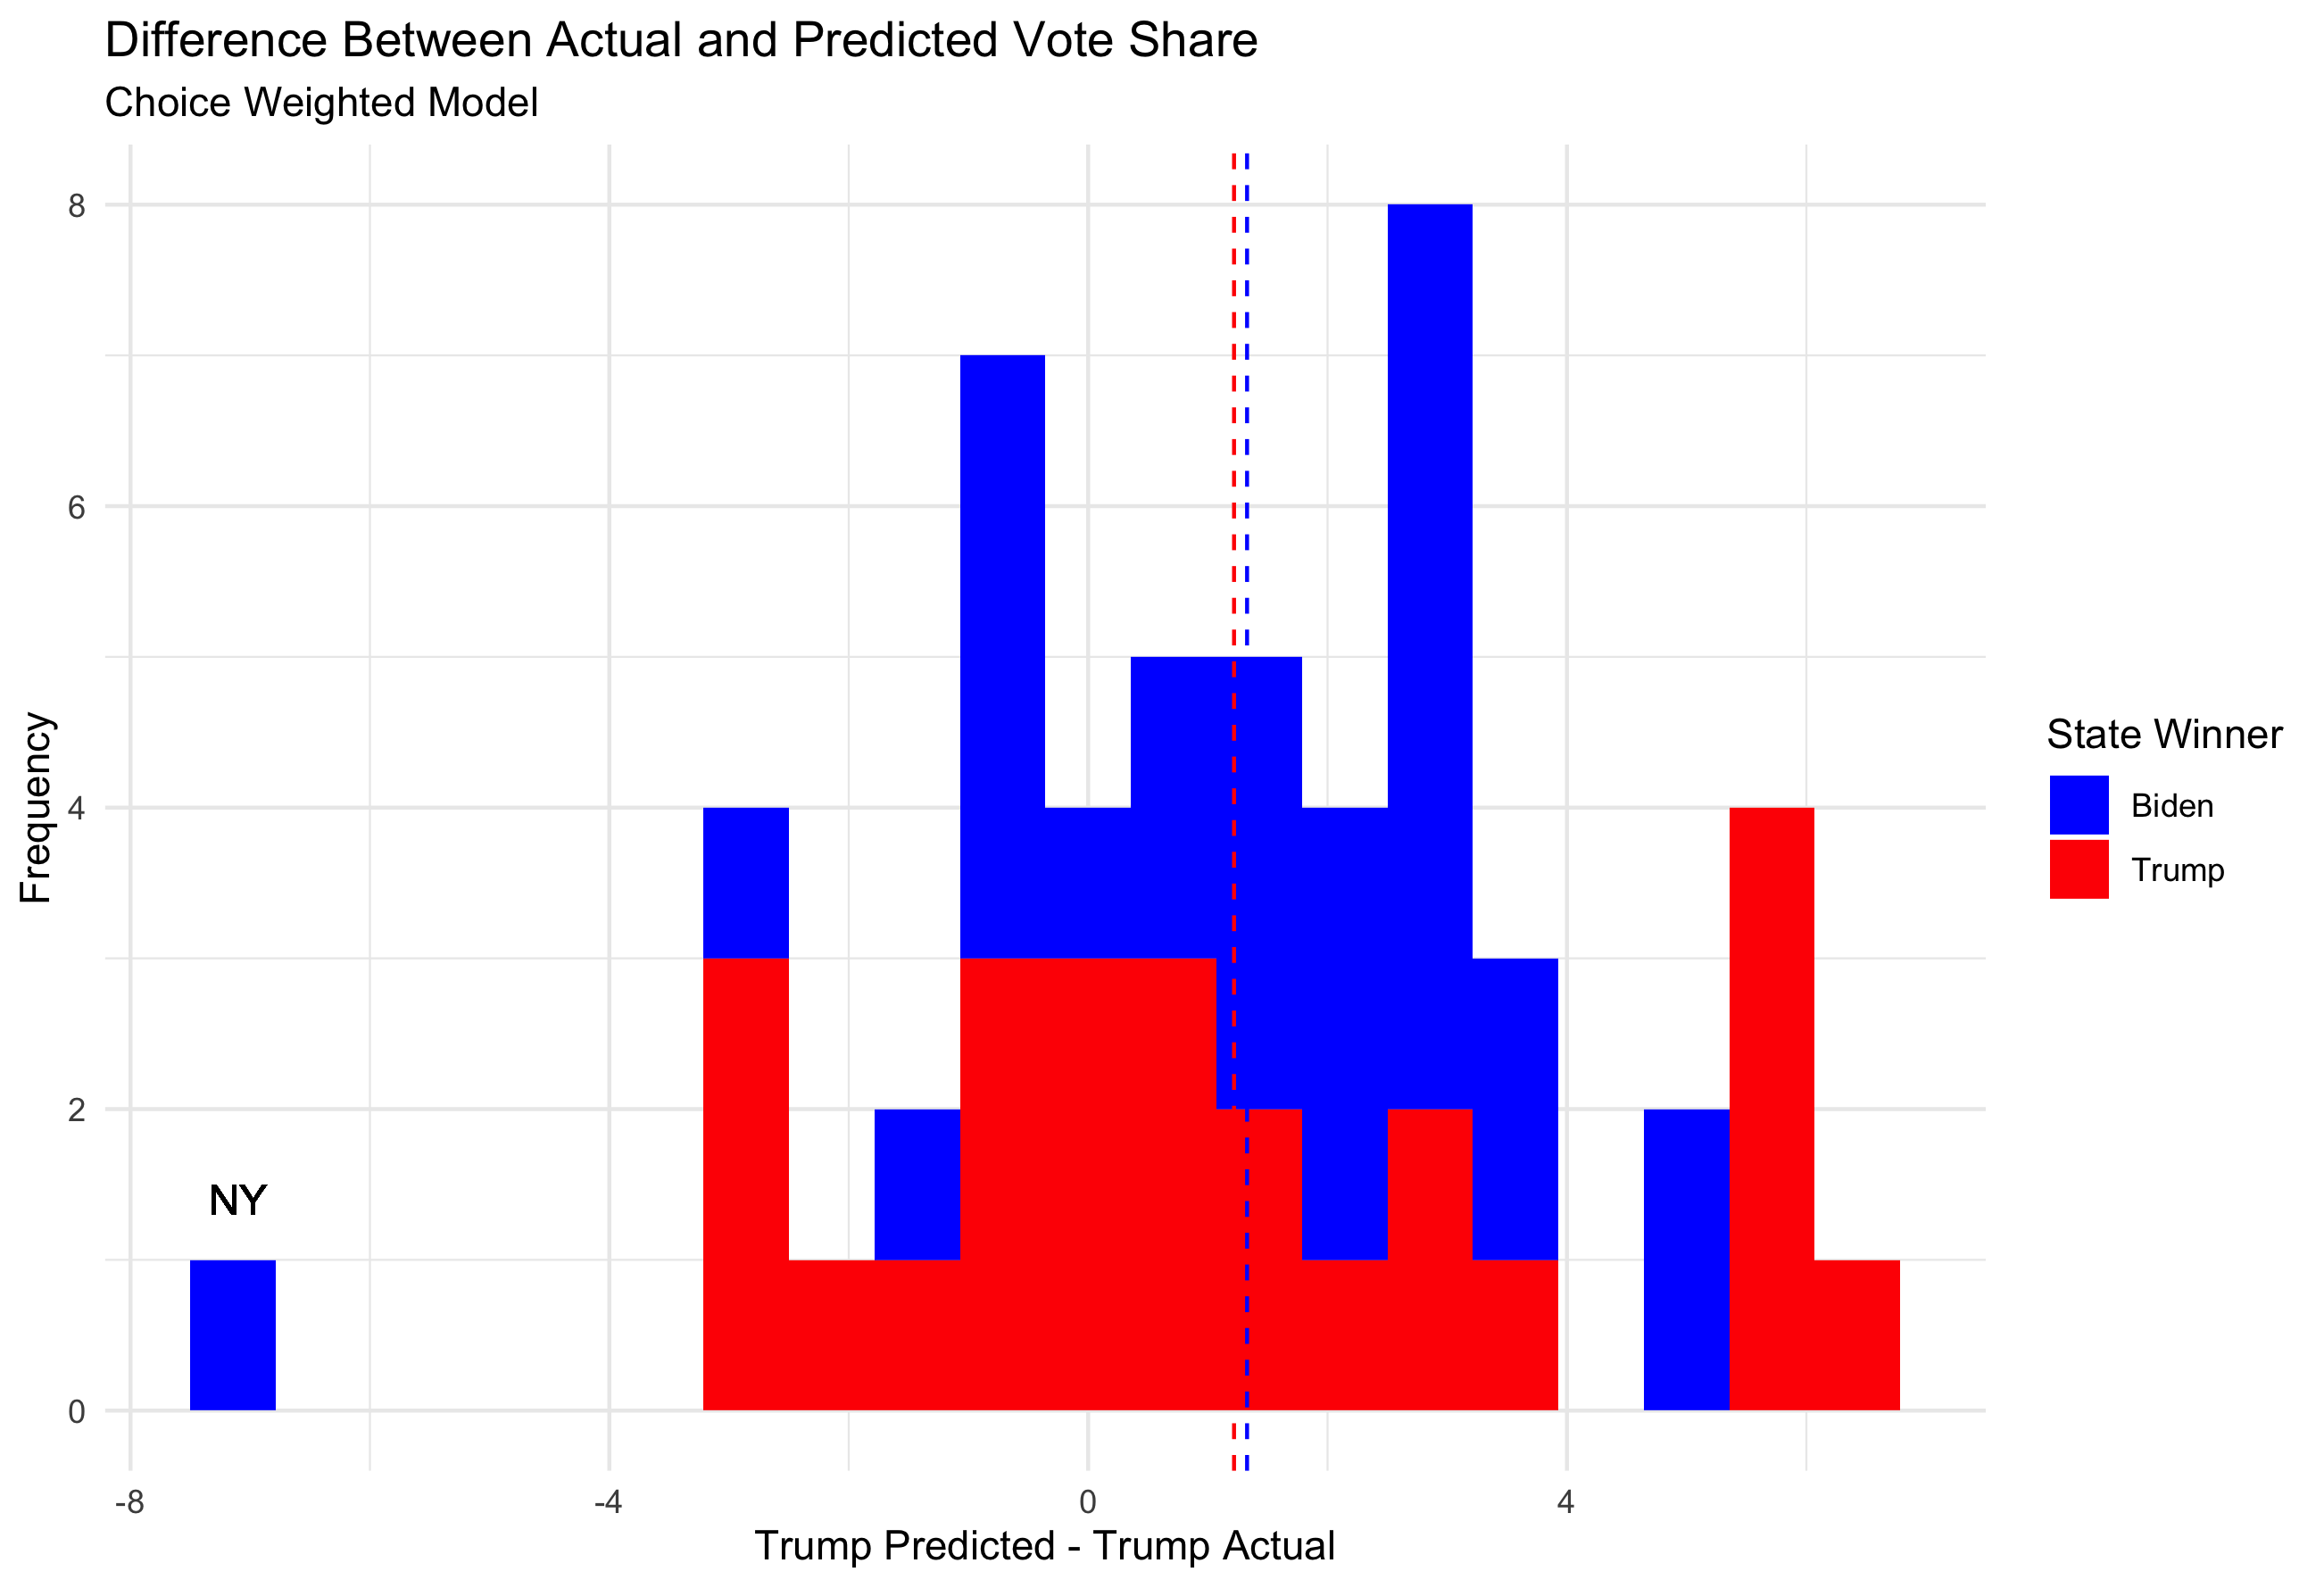
The Choice Model weighted polls most heavily at 0.85, with unemployment, demographics, and COVID-19 death rates all given a weight of 0.05.
The difference between predicted vote share and actual vote share for Trump can be visualized below. The vertical dashed lines represent the average difference between predicted and actual values for states that went to Trump (-2.95) and states that went to Biden (-1.15).
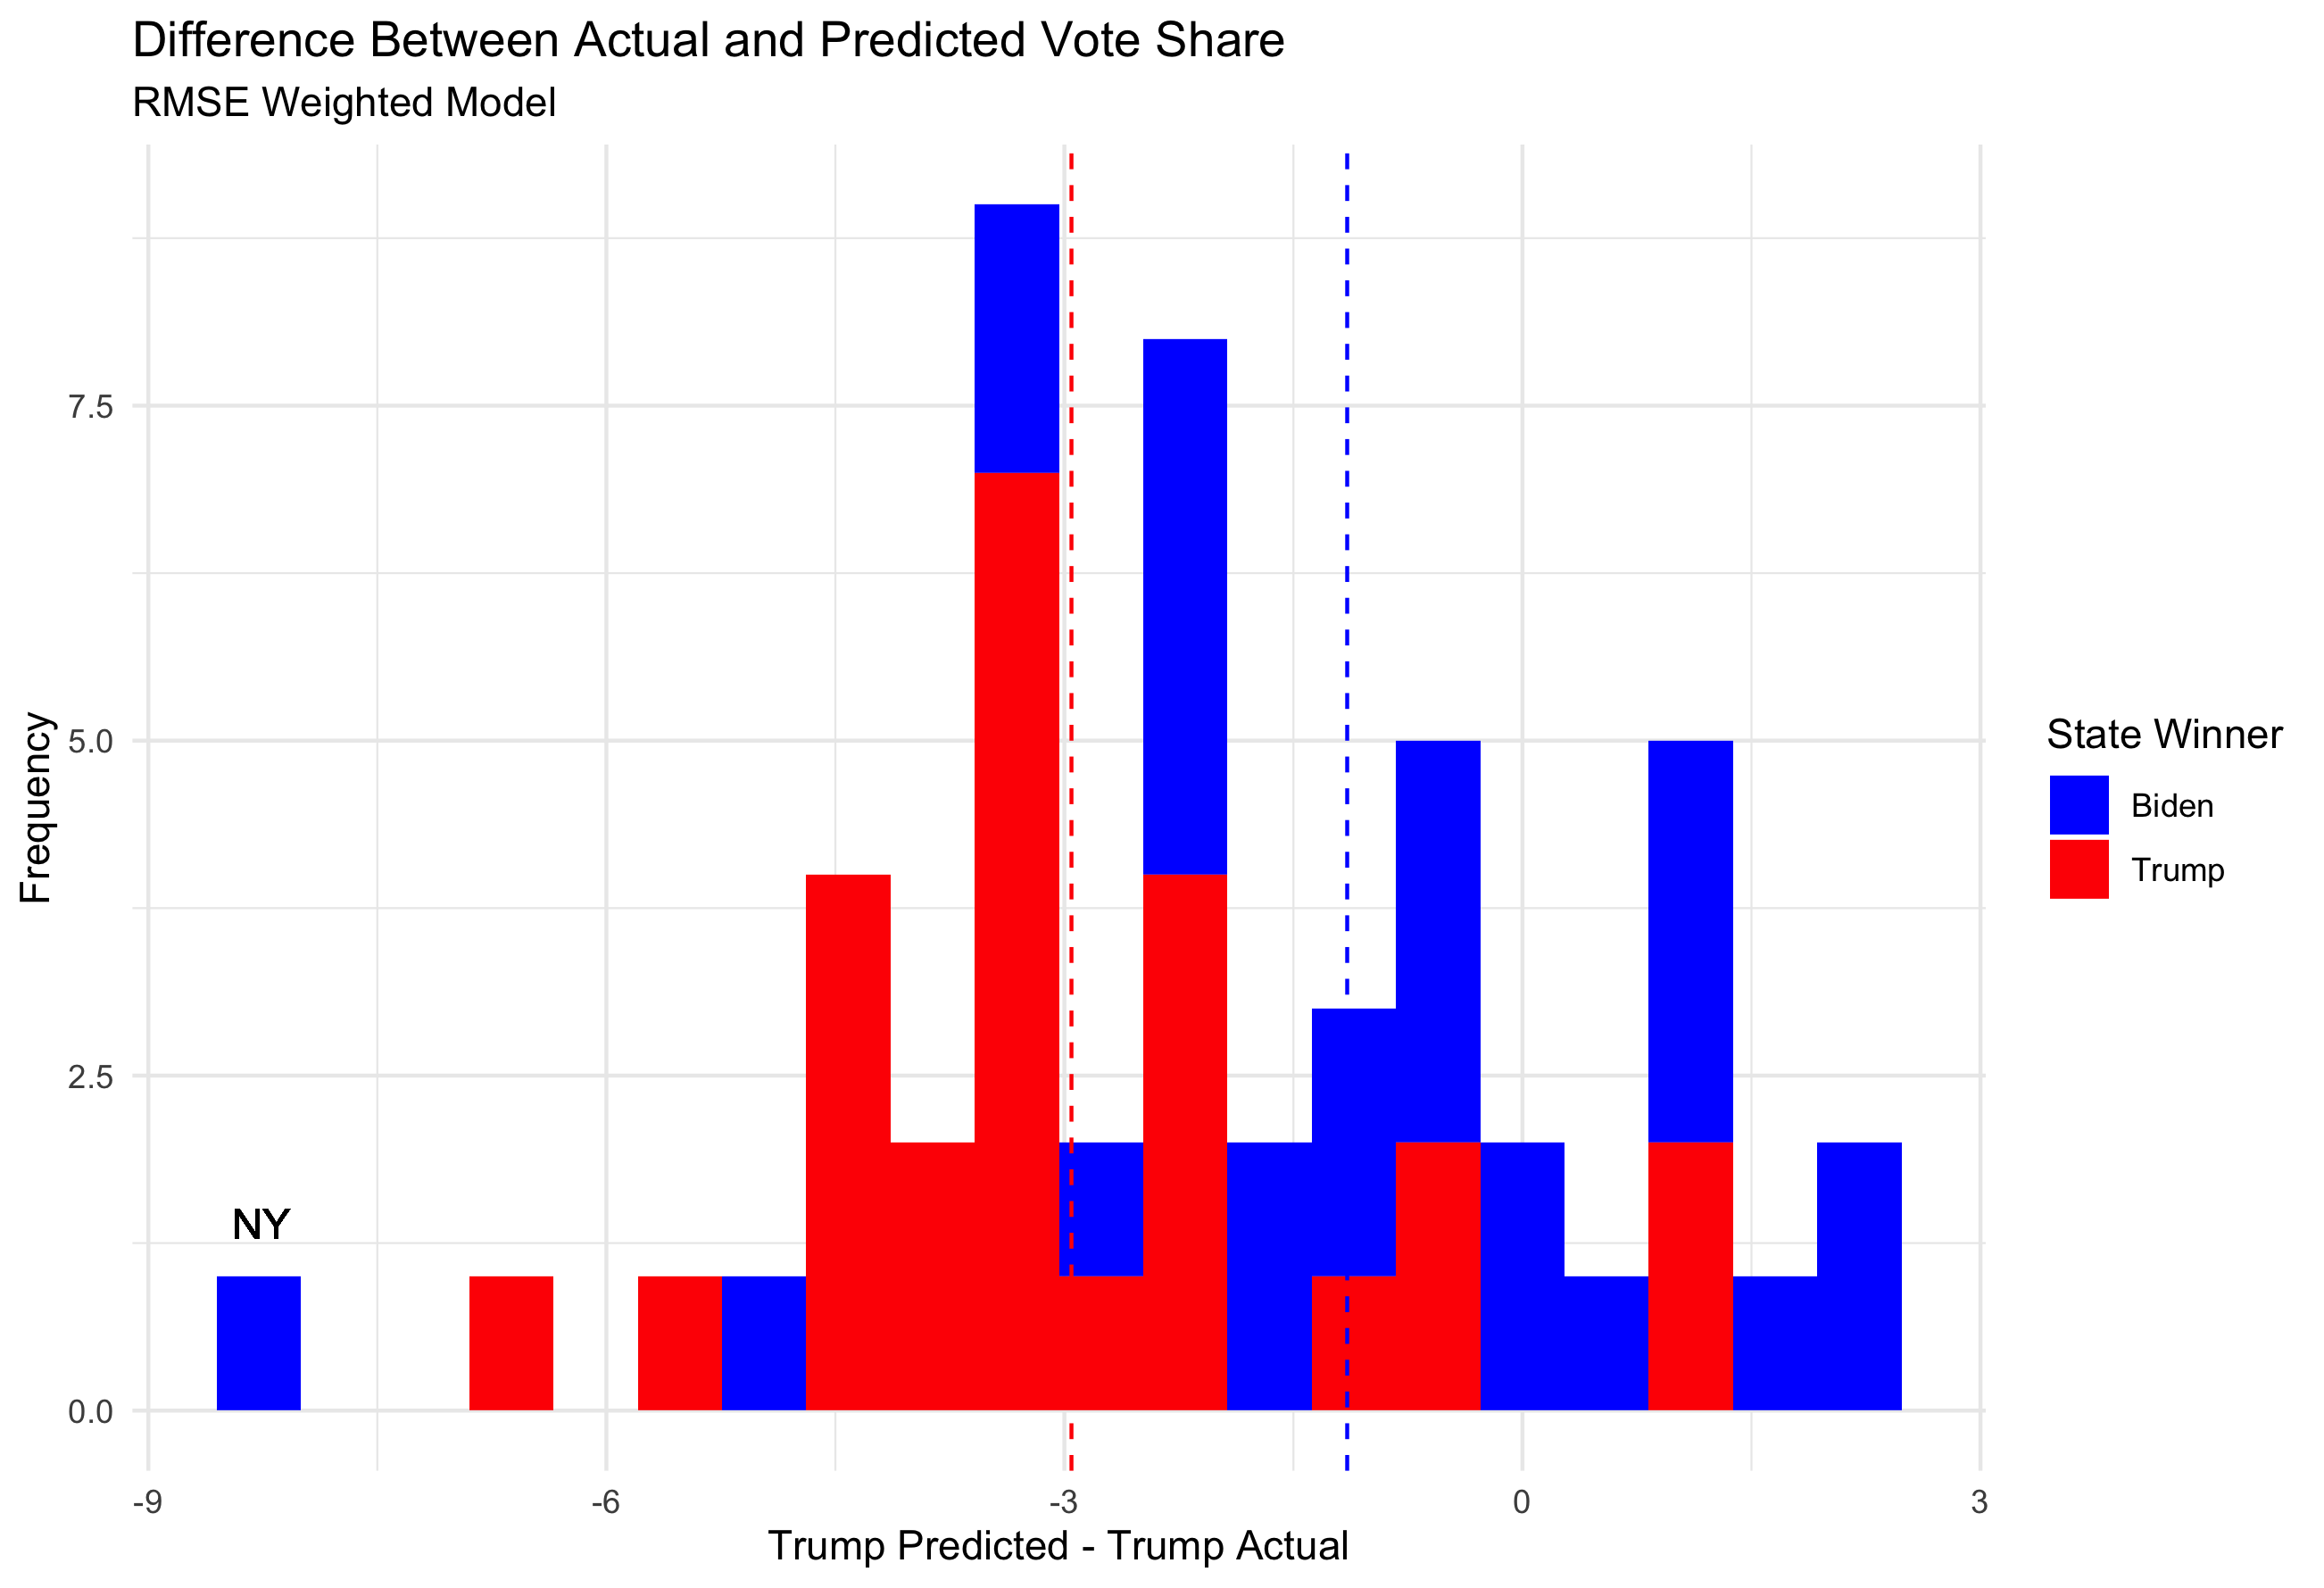 NY had not finished counting at the time of the creation of this dataset, so it is expected its final outcome is more blue than depicted
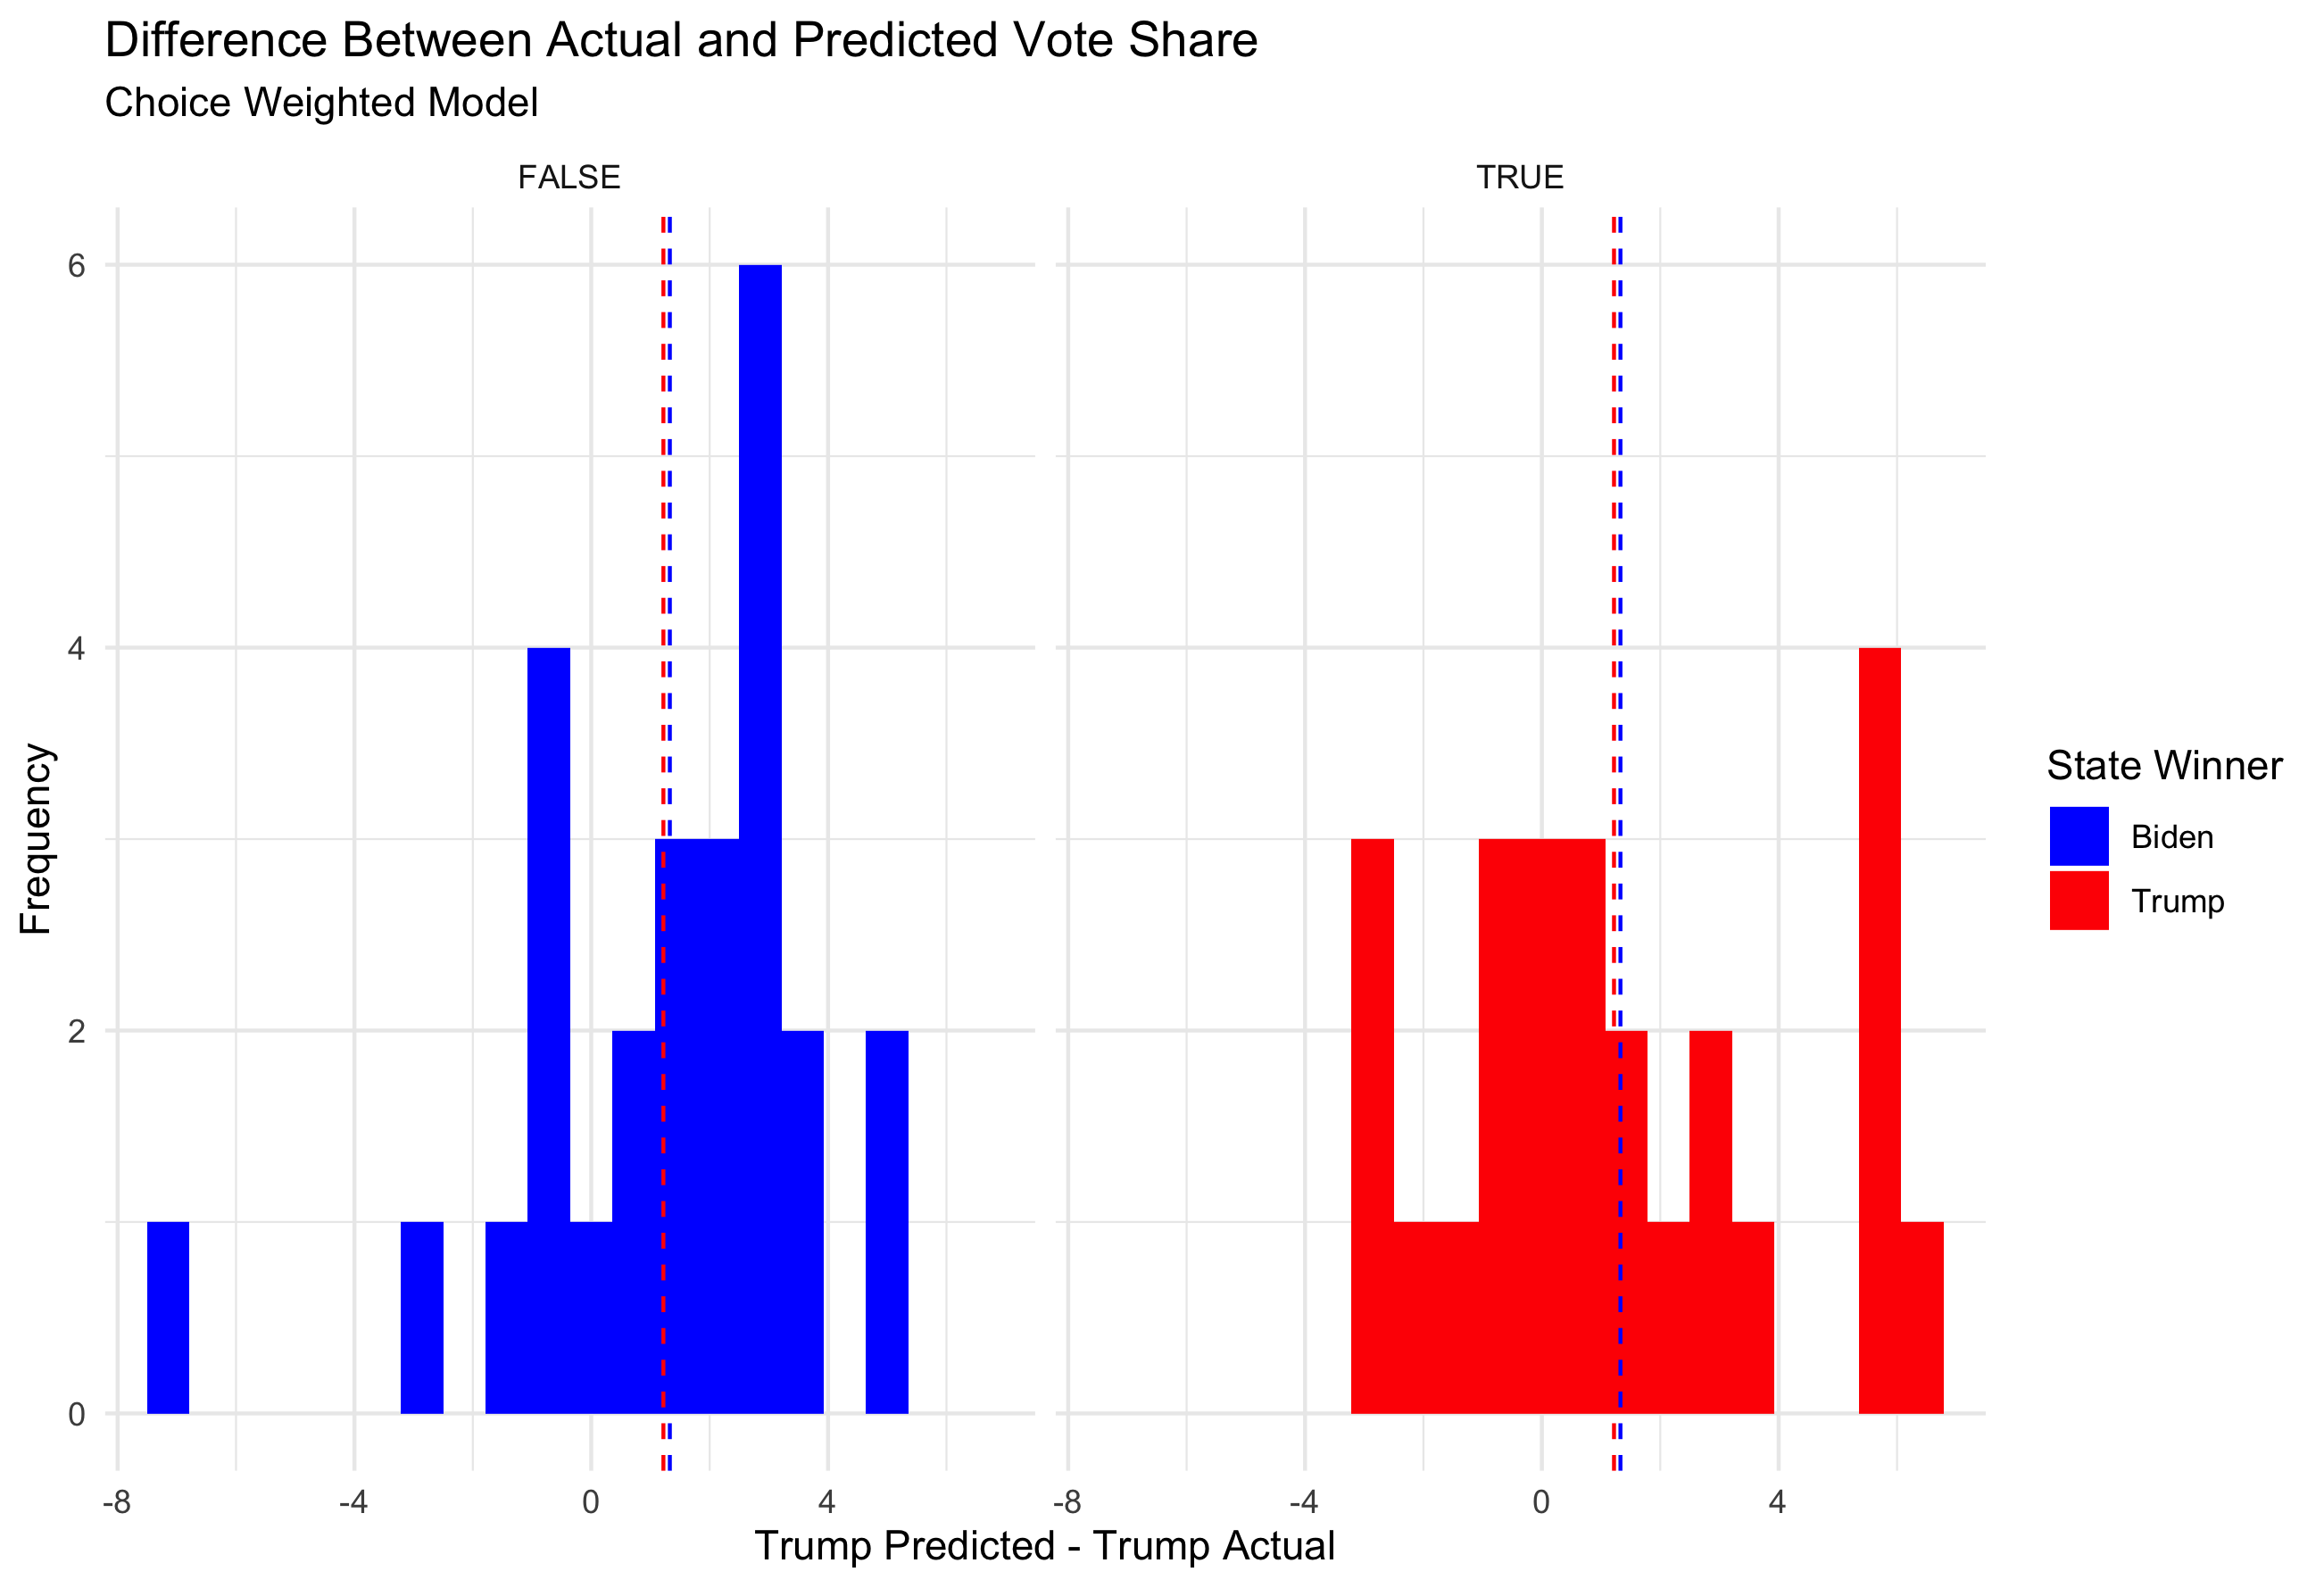
The root mean square error for this model, a measure of how far my predicted values were from the true values, was 3.04.
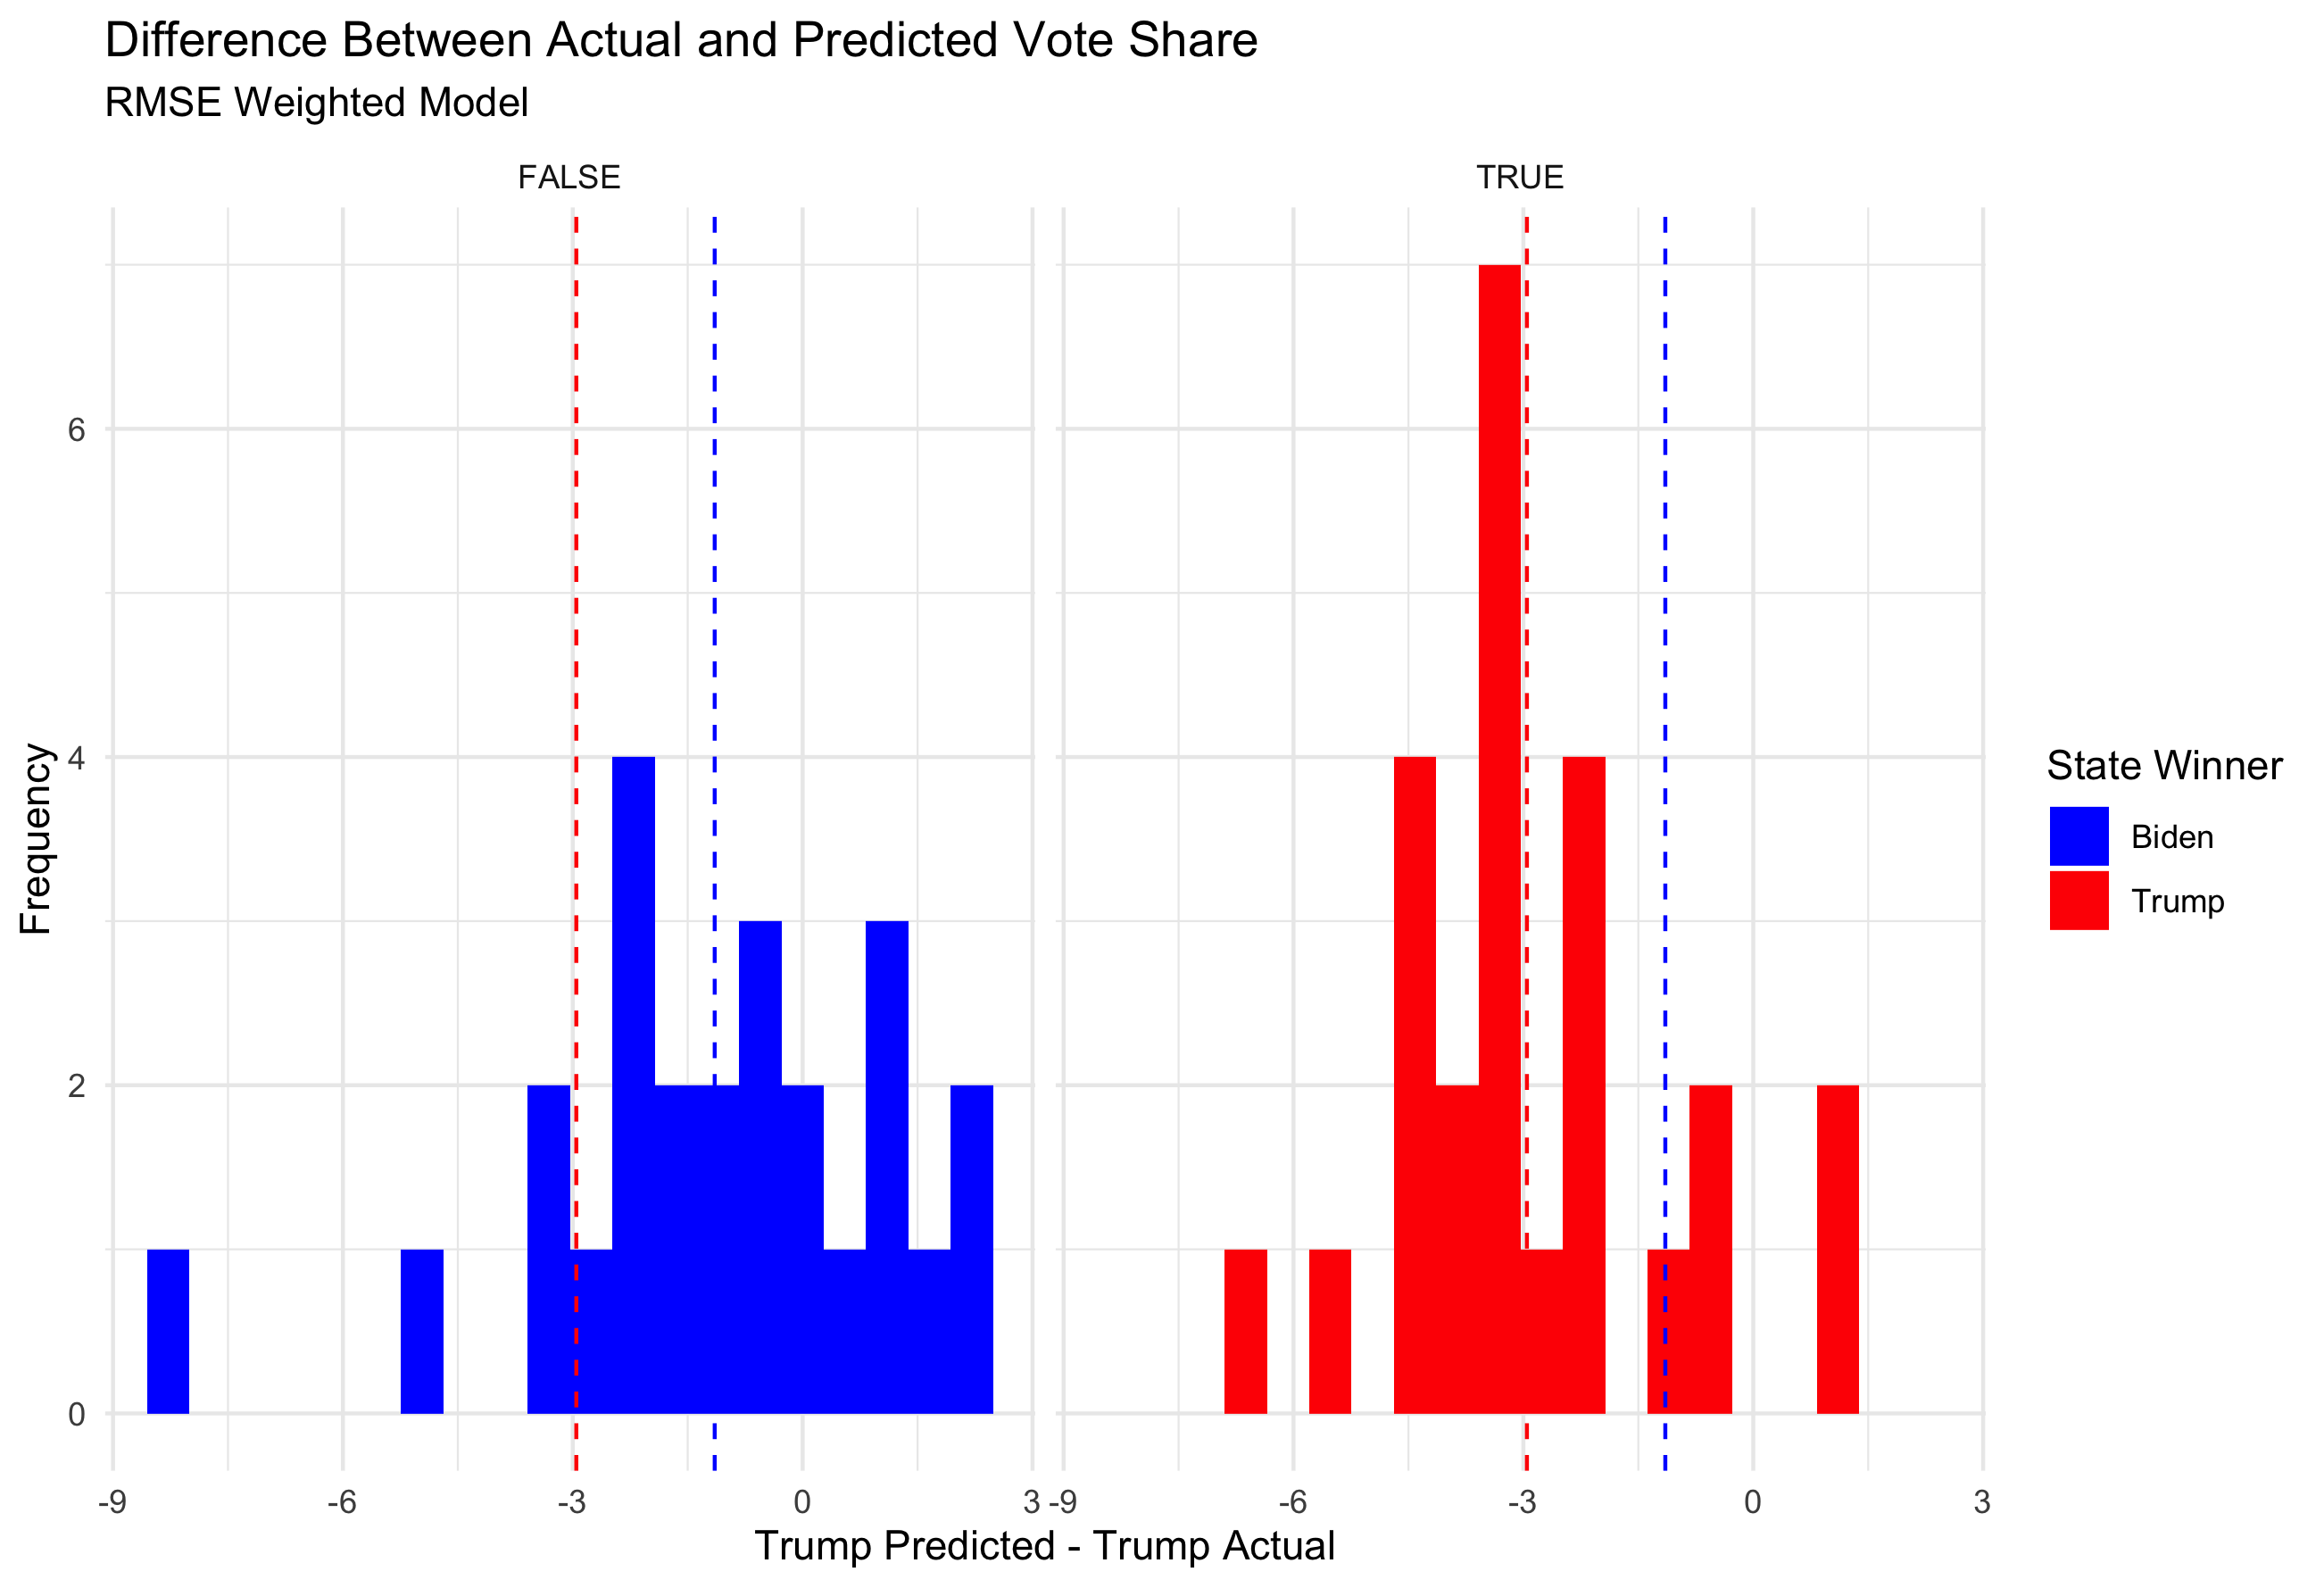
The RMSE values for the model separated by who won the state vary. For states won by Biden, the RMSE value was 2.57 whereas for states won by Trump the RMSE was 3.45. This suggests I was more inaccurate in red states than I was in blue states.
Although I chose the RMSE weighted model in the end, I also wanted to examine how my choice weighted model performed (polls weighted at 0.85, all other models at 0.05). The choice model more closely predicted the true outcome in 28 states, compared to the RMSE model more closely predicting the true outcome in 22.
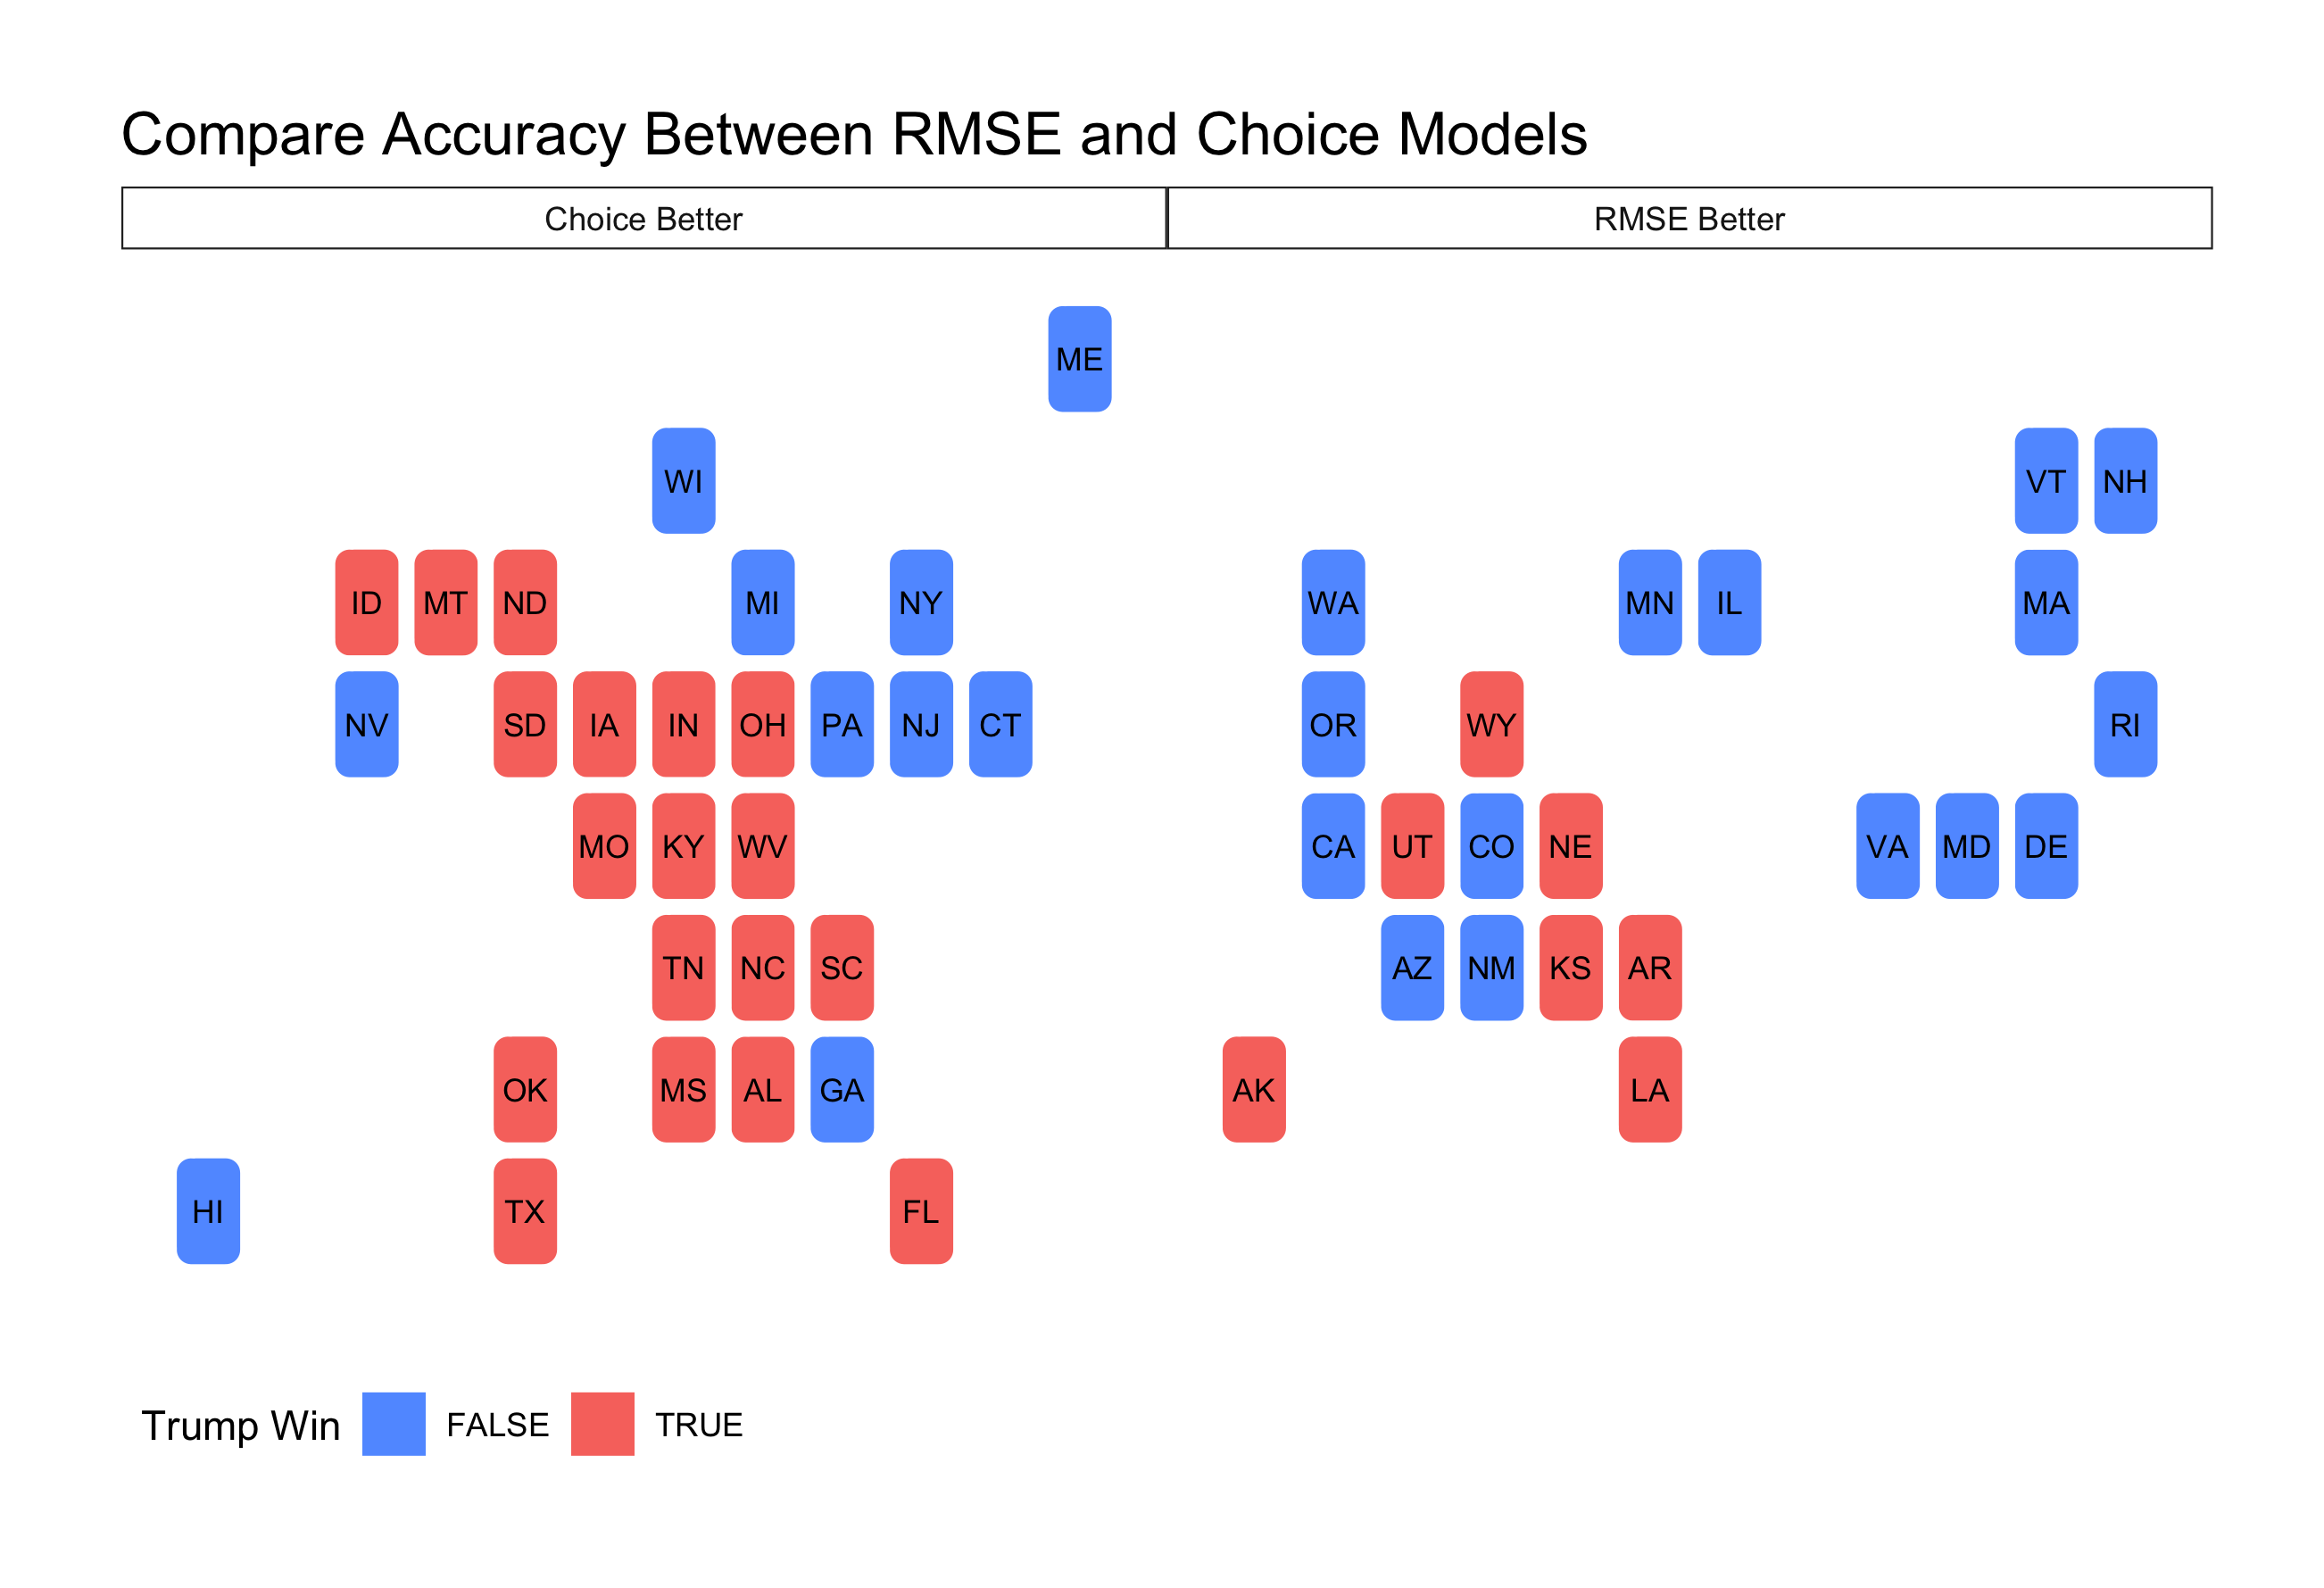
The RMSE model seemed to perform better predicting blue states, while the choice model seemed to perform better predicting red states. Overall however, the choice model was more accurate than the RMSE model. The choice weights model only missed 2 states, Arizona and Georgia, which were the two states with the closest final outcome of all 50 states.
The RMSE for the choice weight model overall was lower than the RMSE weighted model, at 2.98. When separated by red and blue states, the RMSE for blue states using the choice model was 2.84 and for red states was 3.12. For both models it therefore seems I was less accurate in predicting the outcome for states that went to Trump, and consistently overpredicted Biden vote share.
Sources of Inaccuracy
COVID Model
I think a large source of my underprediction of Trump’s performance came from an overreliance on polling data, especially given my inclusion of the COVID-19 model. I included the COVID-19 death rate model in an attempt to represent casualty sensitivity that might decrease support for the incumbent given the pandemic. This model matched polling averages with 7 day death rates, which allowed me to create a generalized linear model that I used to predict vote share depending on the 7-day COVID death rate directly prior to the election.
The thought behind the inclusion of this parameter was that the general public is sensitive to casualties, and a spike in deaths that was predicted right around the election should hurt the incumbent. (Record high cases and deaths were being reported right on and around election day.)
For the RMSE weighted model, each parameter was weighted inversely proportional to its RMSE by state. The COVID-19 model generally had the lowest RMSE, which makes sense given it was modelled off of polls from one year, so was weighted the most heavily. This model of COVID-19 deaths seemed important to include given the magnitude of the pandemic, but in retrospect I don’t think that the matching of polling data with 7-day death rate was the most appropriate way to measure any potential effect of COVID deaths on the election.
- For one, this made my prediction very poll-heavy. In 2020 the polls had a left-leaning bias, which might be a contributing factor in my consistent over-prediction of Biden vote share.
- Changes in polls reflect a response to any number of factors, not coronavirus deaths alone. COVID-19 approval ratings might have been a better source to match on, however lack of data might be a limiting factor.
- As discussed in my post on shocks, there might be partisan differences in perception of how the virus was handled. COVID-19 death rates might therefore impact voters in some states but not others.
In order to test this hypothesis that COVID-19 death rates were not reflected in polling data, it would be useful to compare trends in other measures of public opinion. For example, Presidential approval ratings, or surveys that ask about approval of the handling of the virus could be modelled against COVID-19 death rates and then compared to the model using polls to see if a different type of public opinion survey better reflects casualty sensitivity.
Economic Model
In my attempt to model how the coronavirus might change the election, I neglected to strongly consider how fundamentals might come into play this election. I used unemployment data as an economic model in my final weighted ensemble, but it was not given much weight as it often had a high RMSE score and I gave it little weight in my choice model.
Although in 2020 the pandemic caused a major economic downturn, it is possible that voters did not attribute blame to Trump for the economy. Heely and Lenz discuss why voters substitute the end for the whole in their retrospective analysis of an incumbent, as overall performance is not as readily available to be assessed. In the case of the 2020 election, however, voters might not have used this same assumption of the end being reflective of the whole.
Instead, voters might have considered the pre-pandemic economy as more reflective of what the incumbent could control. In order to test this hypothesis, it would be useful to have a survey quantifying how people attributed responsibility for the economy. This could include questions to understand if people differentially attributed blame for various economic factors like GDP, unemployment status, and RDI. It would be useful to know if people were attributing blame to the President for the election year economy, which would be typical given historical data, or if people were retrospectively assessing the President based on the pre-pandemic economy.
I would assume the answers would vary greatly by party. This might require use of differential weighting of parameters to predict outcomes in various states.
I think that including economic variables is important in the final model, even if they are slightly less predictive than a model based on polling alone. A certain amount of error is expected in polling, so including fundamental parameters may help to buffer an effect that might be felt if all the polls are off by a large magnitude.
Although many news sources are discussing the pivotal role many demographic groups played in this election, I would not necessarily be inclined to include more demographic variables in my final model. I think that including more demographics in the model would fail to capture the variance within demographic groups, for example seen in the Latino community this year, where Trump made gains with Cuban-American voters in Florida, but lost Latino support in Arizona.
If I Were to Do It Again…
If I were to predict this election again, I would change my model in a few ways:
- I would remove the COVID-19 death rate model from the ensemble.
- I would test more economic variables to decide which one was actually most predictive, and include that more heavily weighted in my final model.
- would use weighting based on my intuition rather than RMSE, as that led to me giving too much weight to a parameter that might not have had any real predictive value.