2020 Presidential Elections Analysis
Cassidy Bargell
View the Project on GitHub cassidybargell/election_analytics
Home
Economic Fundamentals
9/21/20
The state of the economy is considered an election fundamental. Economic factors are fundamental because they are not directly controlled by candidates, unlike for example campaign strategies (Sides and Vavreck).
Economic variables can also act as a proxy for many other factors voters care about when they go to the polls. Compared to other issues that might not be as readily quantifiable, economic information is generally accessible. Economic variables are therefore useful for creating predictive election models. How well will these economic predictive models work for the 2020 election in which there has been an unprecedented economic downturn due to the global pandemic?
During an election, an incumbent generally will be rewarded or punished by American voters for perceived performance, a concept based on the retrospective theory of political accountability (Achen and Bartels). TThe end-heuristic voter behavior model also supports the idea that people will substitute end conditions for an assessment of the whole period (Healy and Lenz). Despite intention to weigh all years of an incumbent’s performance equally, cumulative performance information is not generally as available and would require serious individual voter effort to accurately compute (Healy and Lenz).
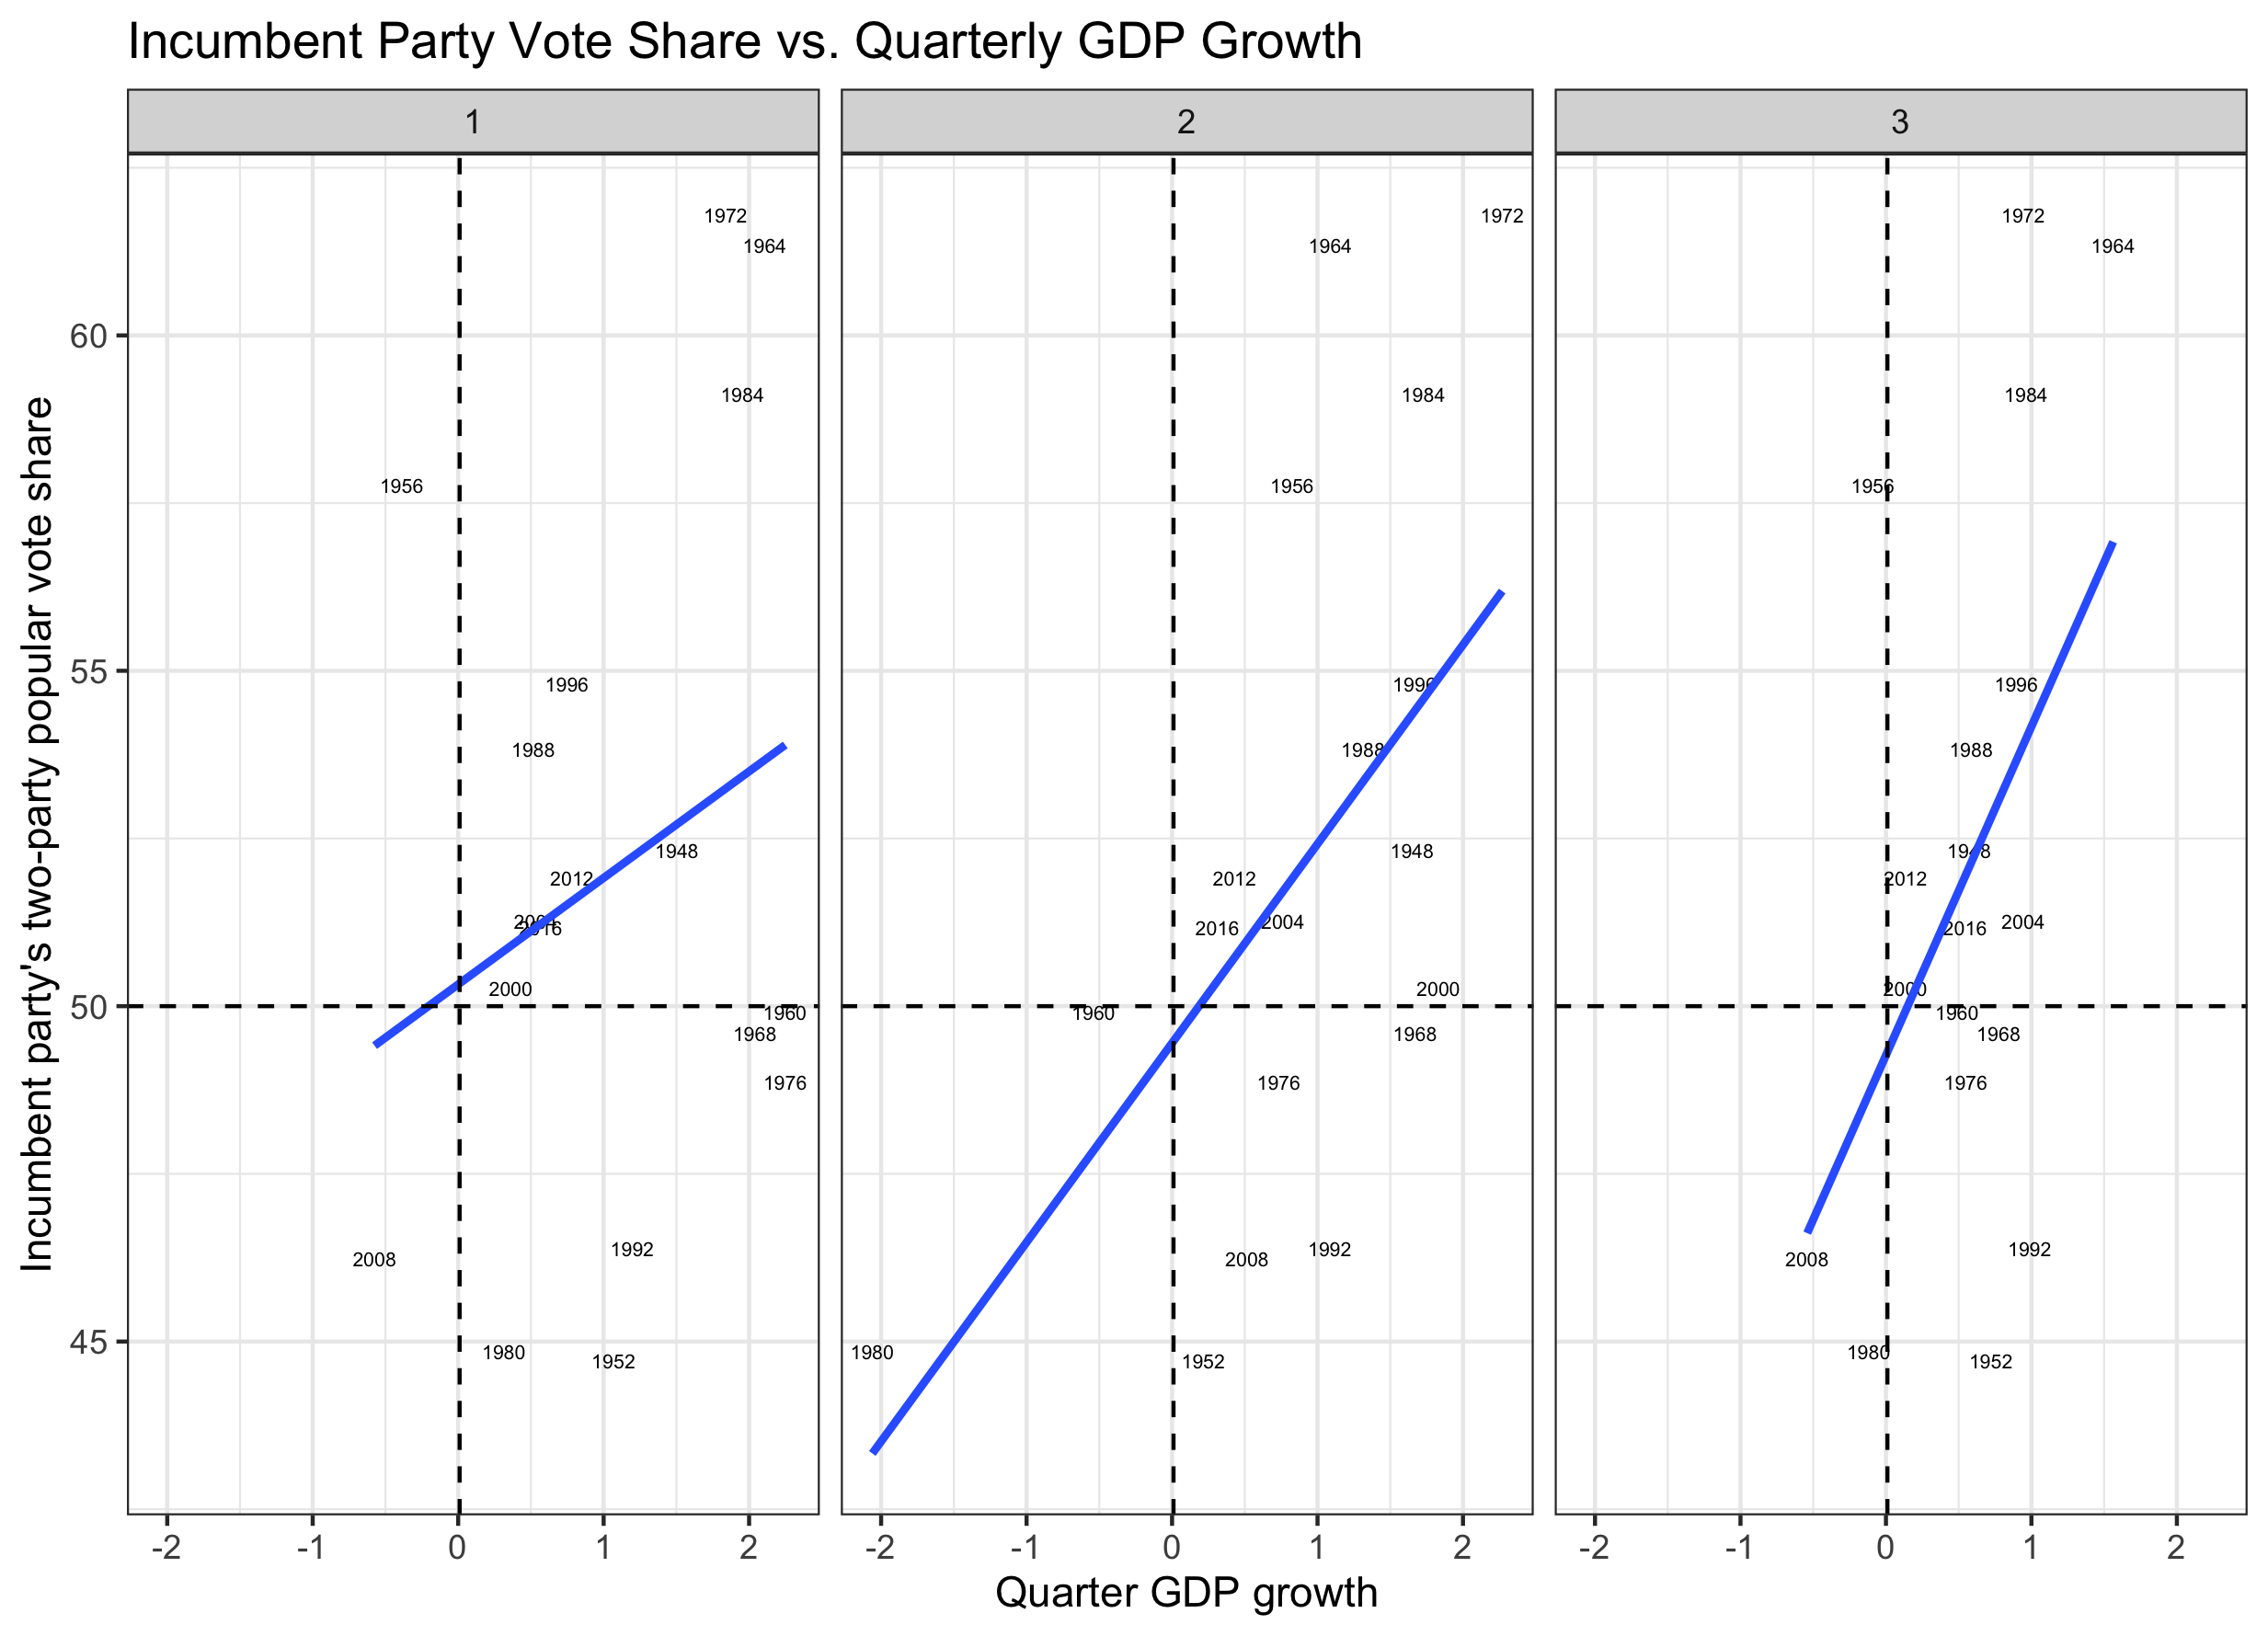
Using historical data from past presidential election years, the linear model between quarter GDP growth rate and incumbent share of two-party popular vote can be visualized with the following model:

Although Q3 provides the strongest correlation for election prediction, data for the election year Q3 GDP is often not available until close to the election itself.
Using the Q2 linear model, two-party popular vote share (pv2p) for the incumbent can be estimated with the following equation, pv2p_{predicted} = 49.449 + 2.969 * GDP_{Q2}. This can be interpreted as, if the GDP growth was 0 we would expect a vote share of 49.449% for the incumbent. For every 1% change in the quarter GDP growth we would expect an increase of 2.969% popular vote share for the incumbent.
The t-values for both the intercept (49.449) and the slope (2.969) are 35.425 and 2.783, respectively. With both t-values > 2 is unlikely this is a random correlation.* The mean out-sampled error for the Q2-GDP predictive model, leaving out 8 years of data and iterating 1,000 times, was 1.7833.*
Using this Q2 predictive model and the 2020 Q2 GDP, we would predict only a 21.3% vote share for the incumbent, an unparalleled Trump defeat. This estimate, however, seems unreasonable as it would be the lowest incumbent vote share by over 15 percentage points in the post-war era.
The prediction data used was the 2020 Q2 GDP, which was historically low and not representative of the economic trends from the pre-COVID-19 Trump term. Using the same Q2 predictive model with the 2019 Q4 GDP, before the shock of the pandemic, gives an estimate of 51.2% popular vote share for the incumbent, actually predicting a Trump win. Using an average of all the quarters before 2020, the same model would predict 51.3% of the two-party vote share going to Trump.
A similar model of linear regression can be constructed using the entire election year GDP, pv2p_{prediction} = 47.6993 + 1.2015 * GDP_{year}, t-values of 45.347 (intercept) and 4.74 (slope), and a mean out-sample error of 1.8124. If the average of the 2017-2019 GDPs (before coronavirus shock, and more robust than one quarter) is used as an estimate to evaluate the economy under the incumbent, there would be a predicted 50.7% slim win margin for Trump.
Because of the COVID-19 economic shock, using the GDP as a predictor for the 2020 election may not carry much weight, despite the historical strength of such models.
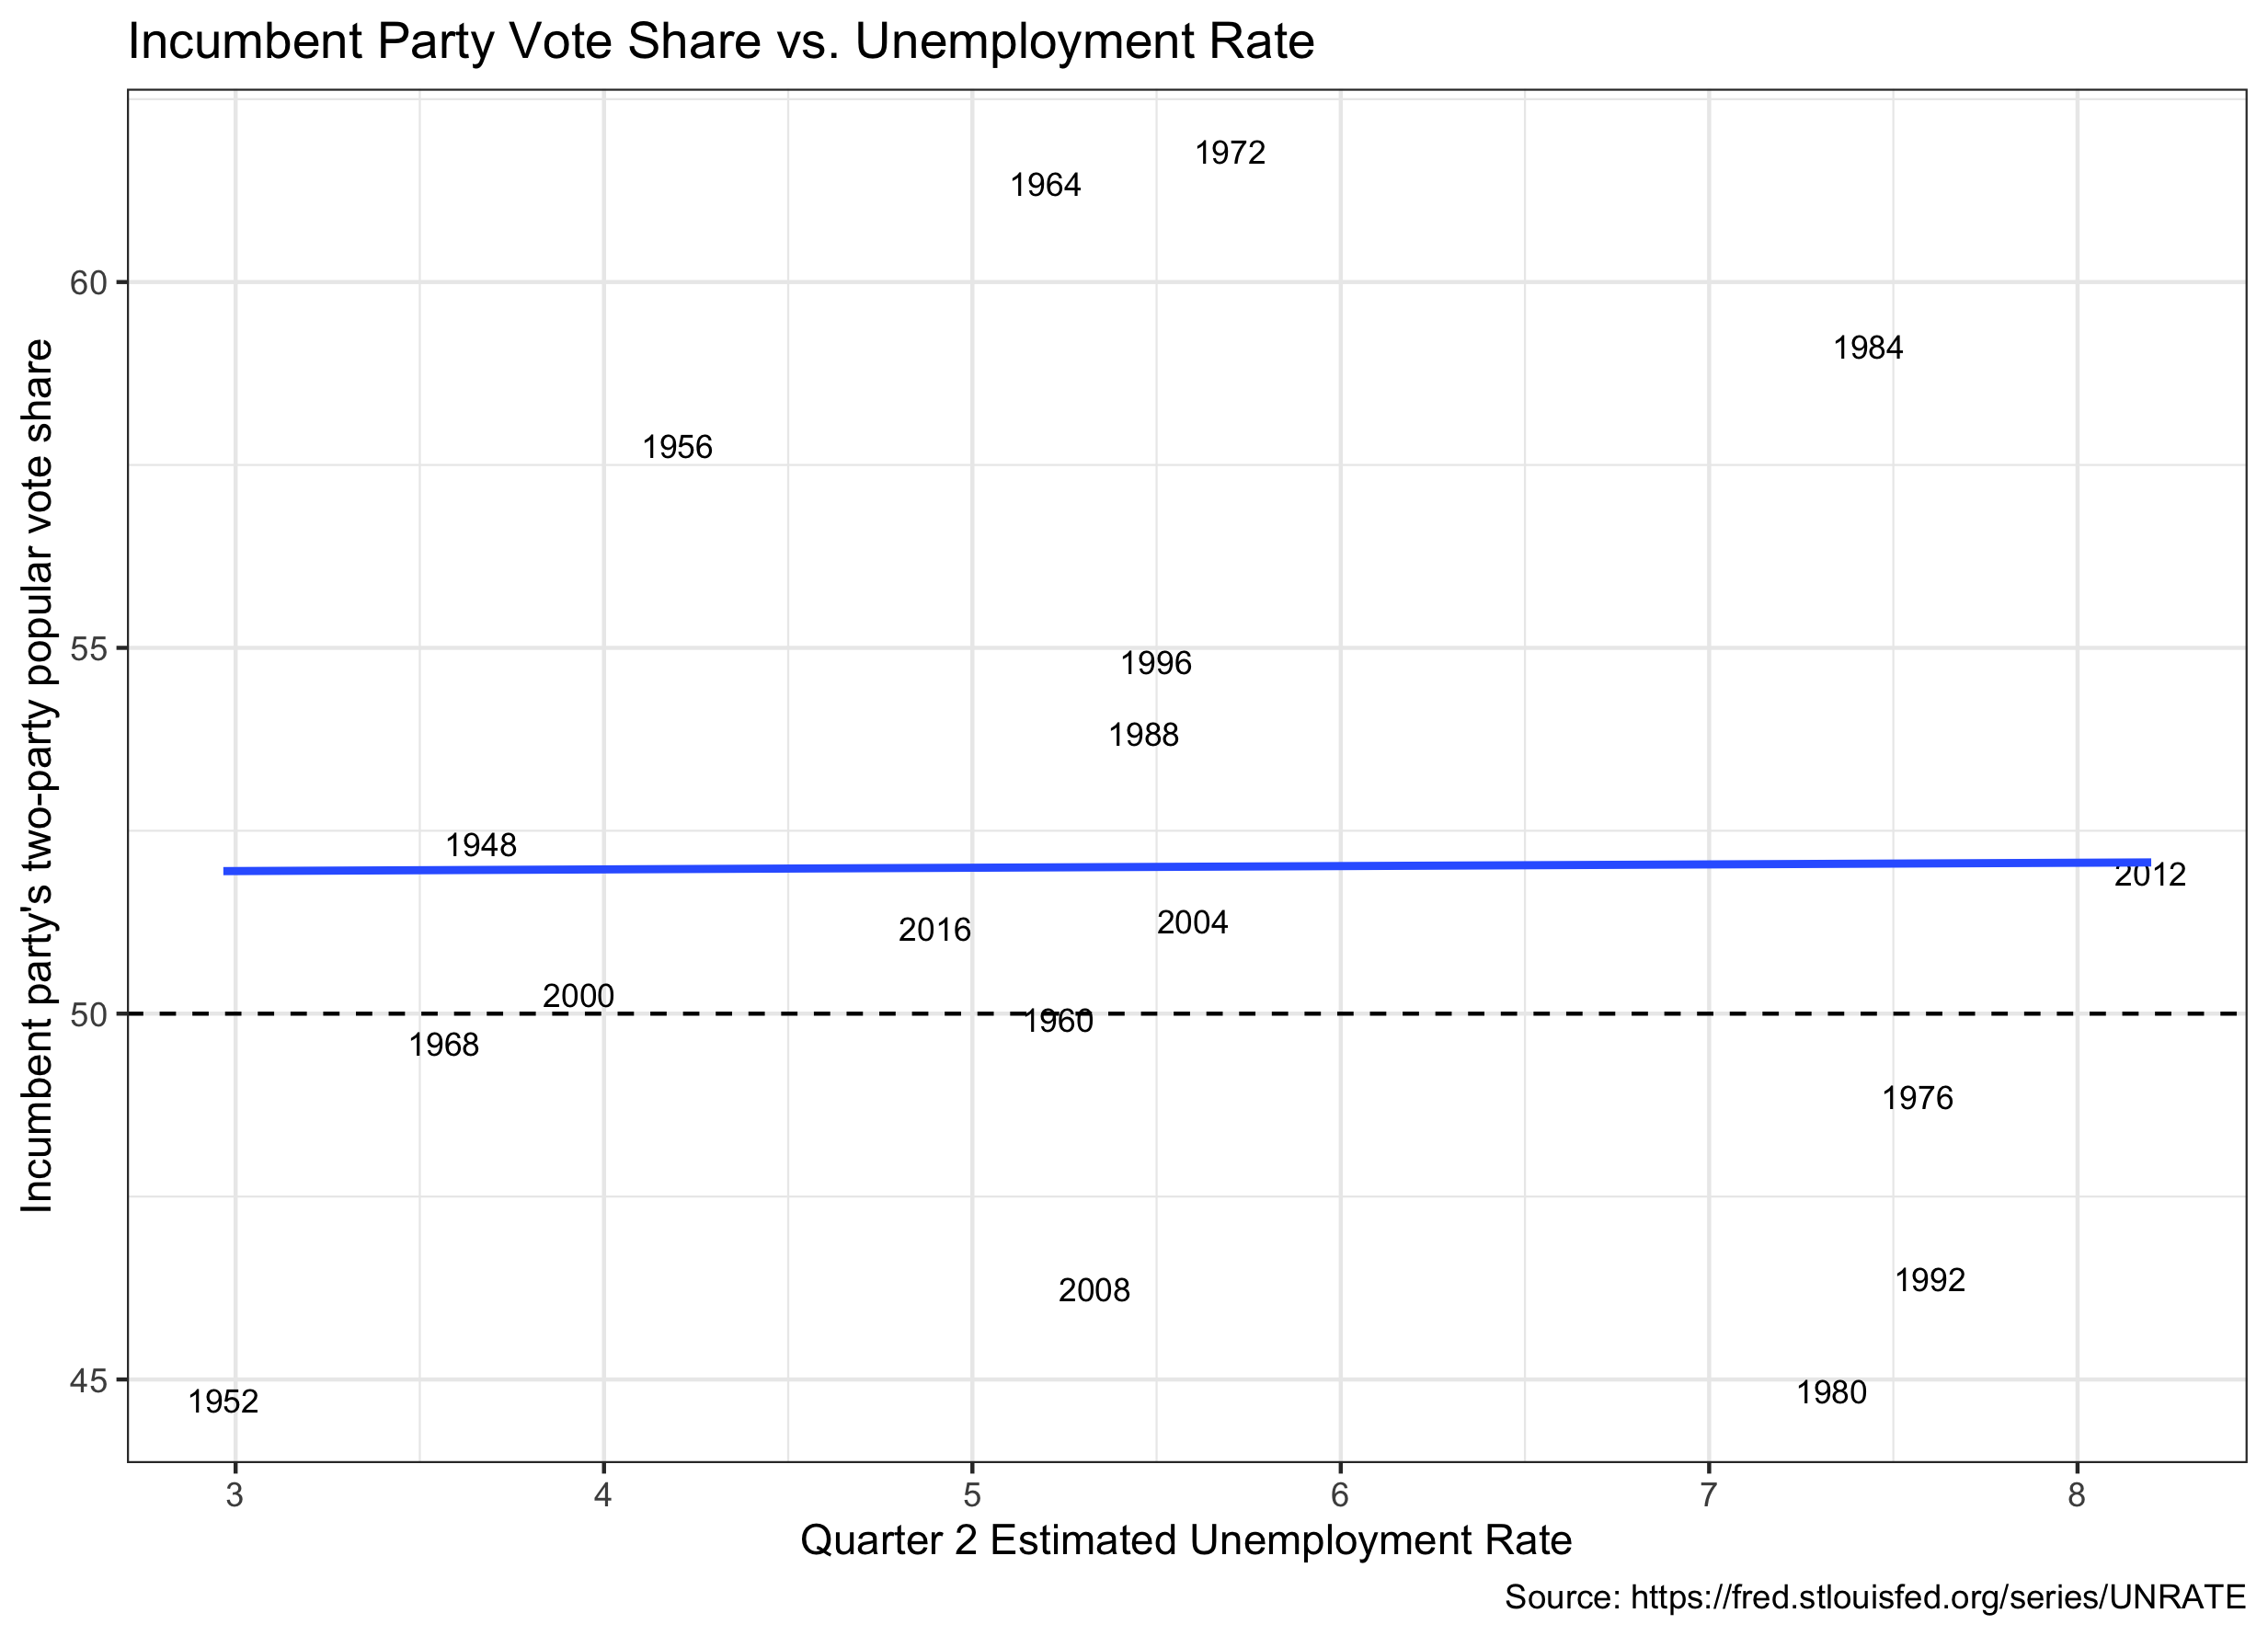
Examining other economic variables, may prove valuable in predicting the 2020 election. Unemployment rates can be another proxy for economic strength, and might actually be a more salient consideration than the GDP for the general population.

The linear model using historical unemployment rates (unrate) (FRED), is pv2p_{predict} = 51.881 + 0.022 * unrate_{2020}. The t-value for the slope in this model is 0.027, and the slope is very close to 0, so I would not consider this particular model to hold significant predictive power. (The estimate is provides is 52.2% of popular vote share for the incumbent with an mean outsampled error of 2.139).
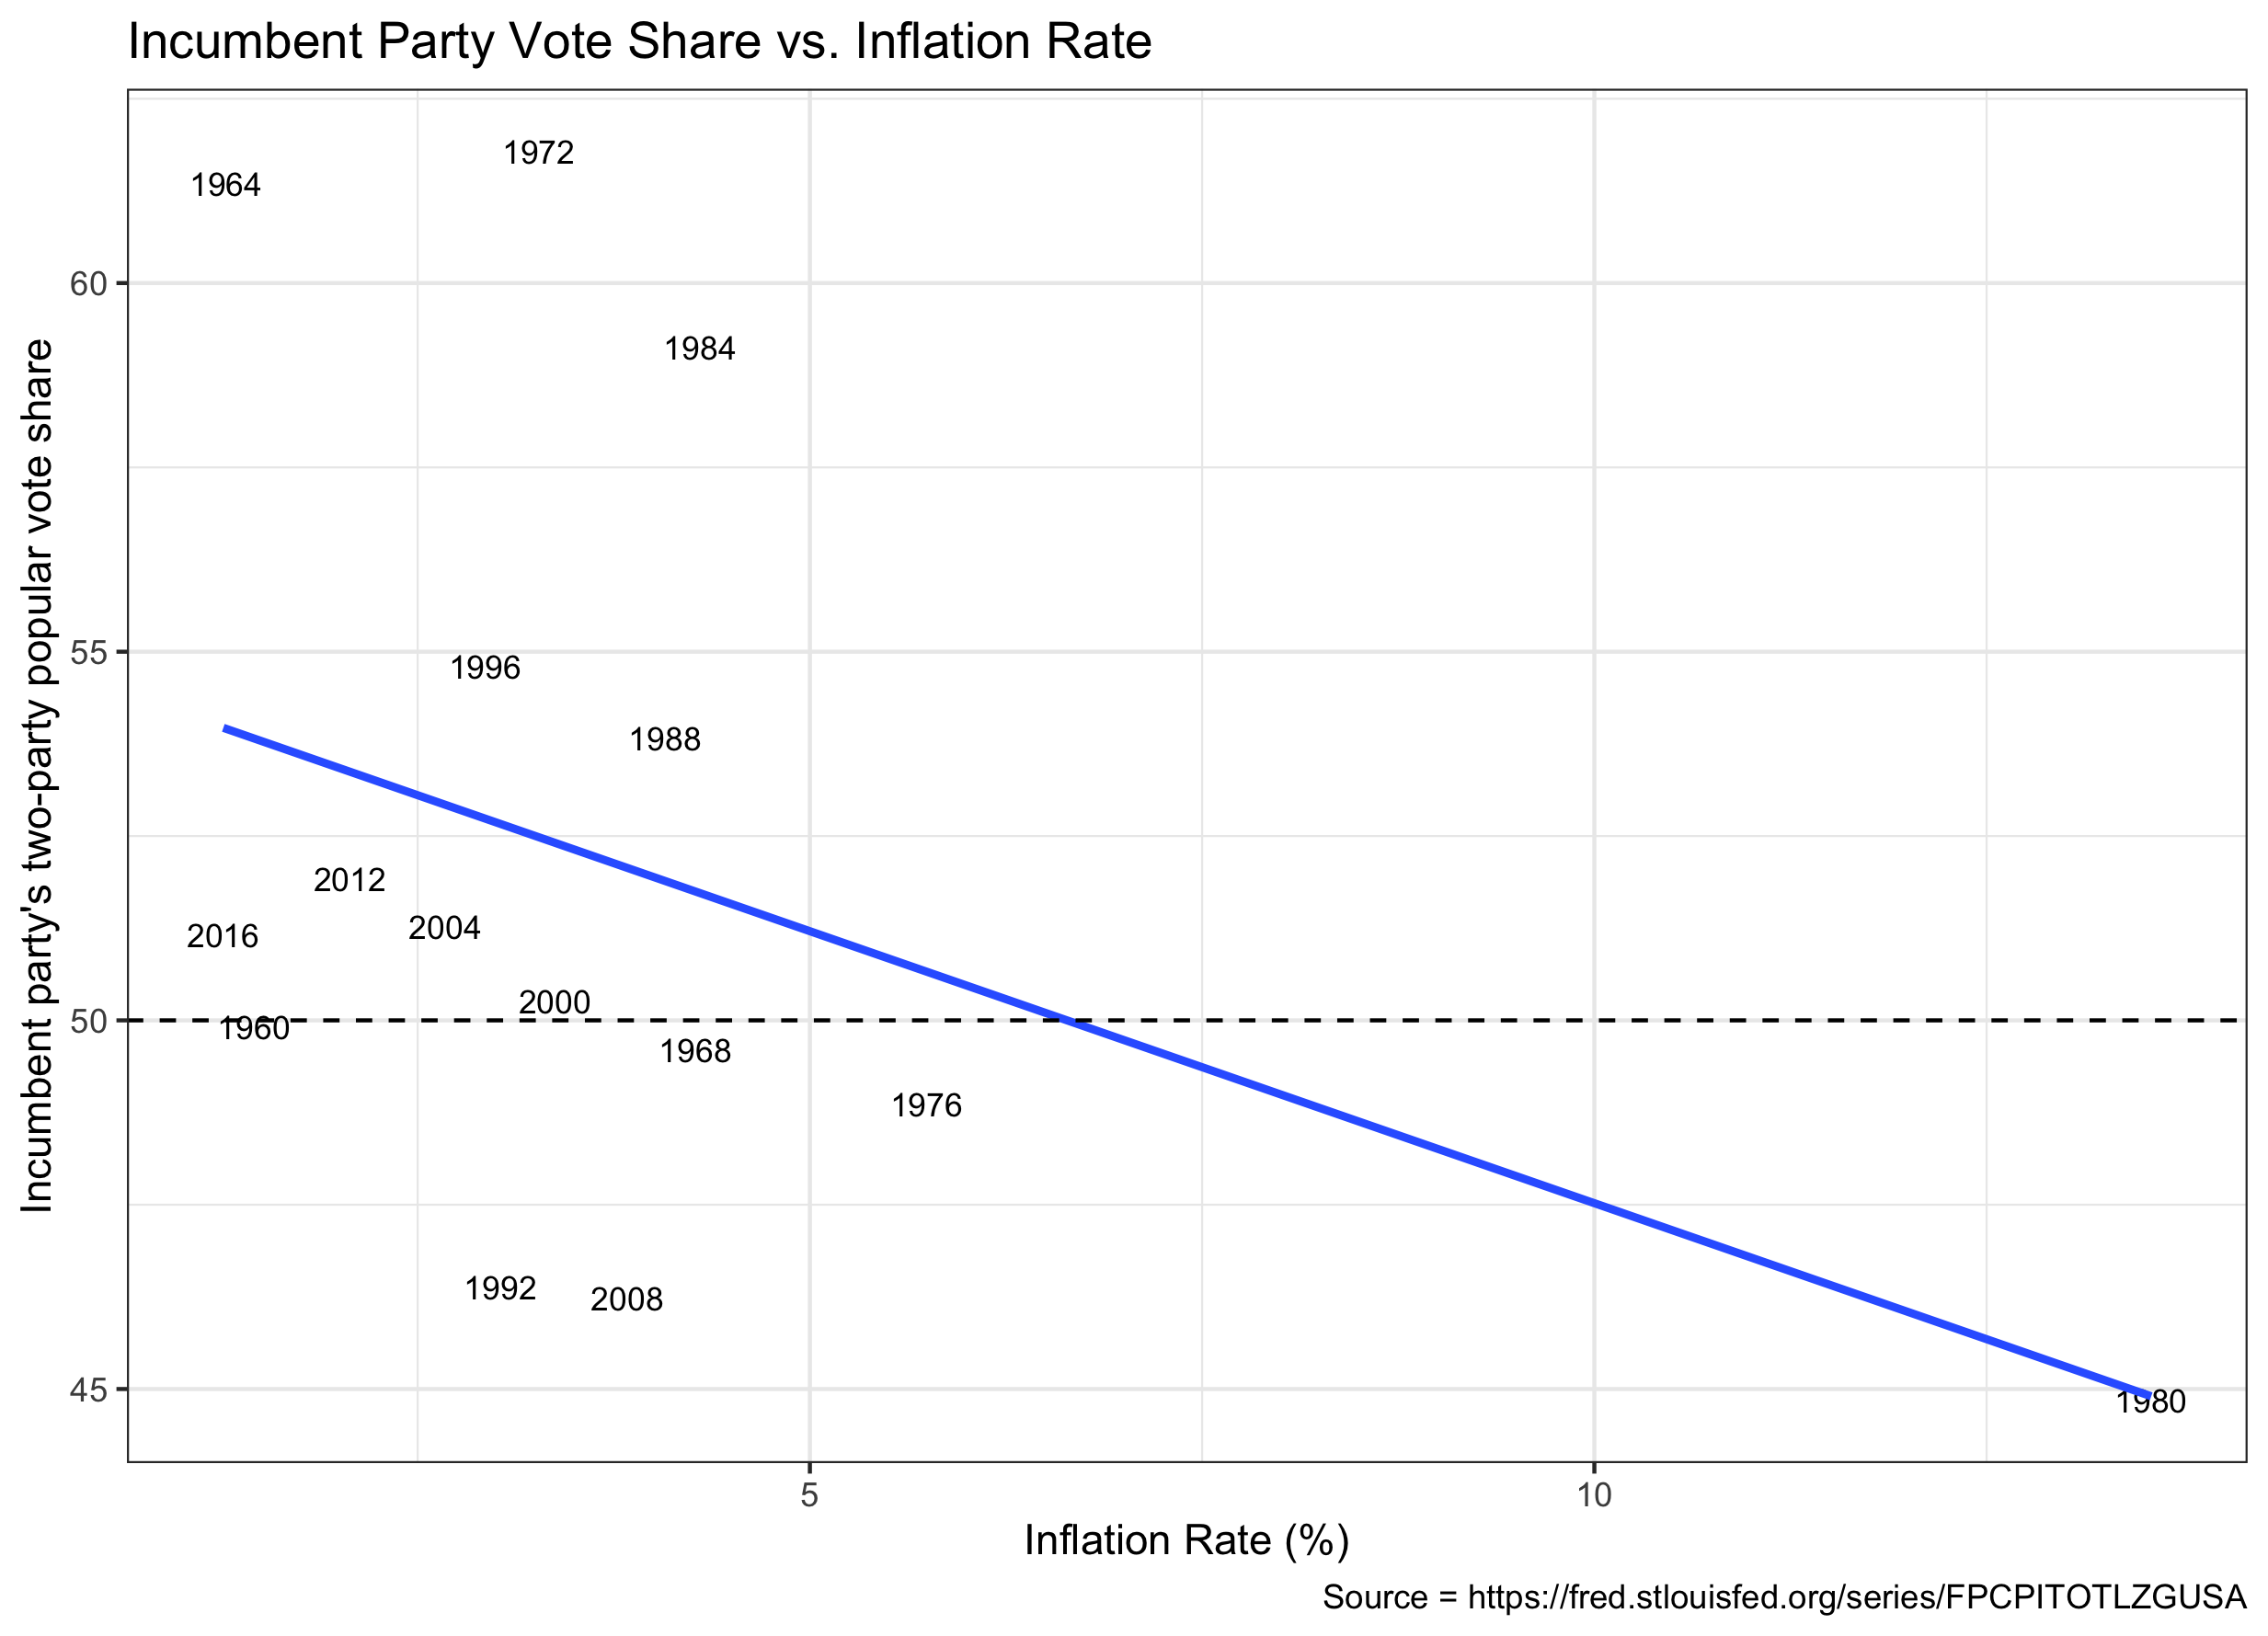
Inflation is another economic indicator potentially useful for prediction. Using historical yearly inflation rates, the linear model relating inflation and two-party popular vote share is visualized below (FRED).

The linear regression in this model is pv2p_{predict} = 54.8986 + -0.74 * inflation_{2019}, which predicts Trump would receive 53.6% of the two-party popular vote share. The model, however, has a mean outsampled error of 2.3 and a t-value < 2 for the slope. Similar to the conclusion drawn from unemployment rates, I have little confidence in this model’s accuracy.
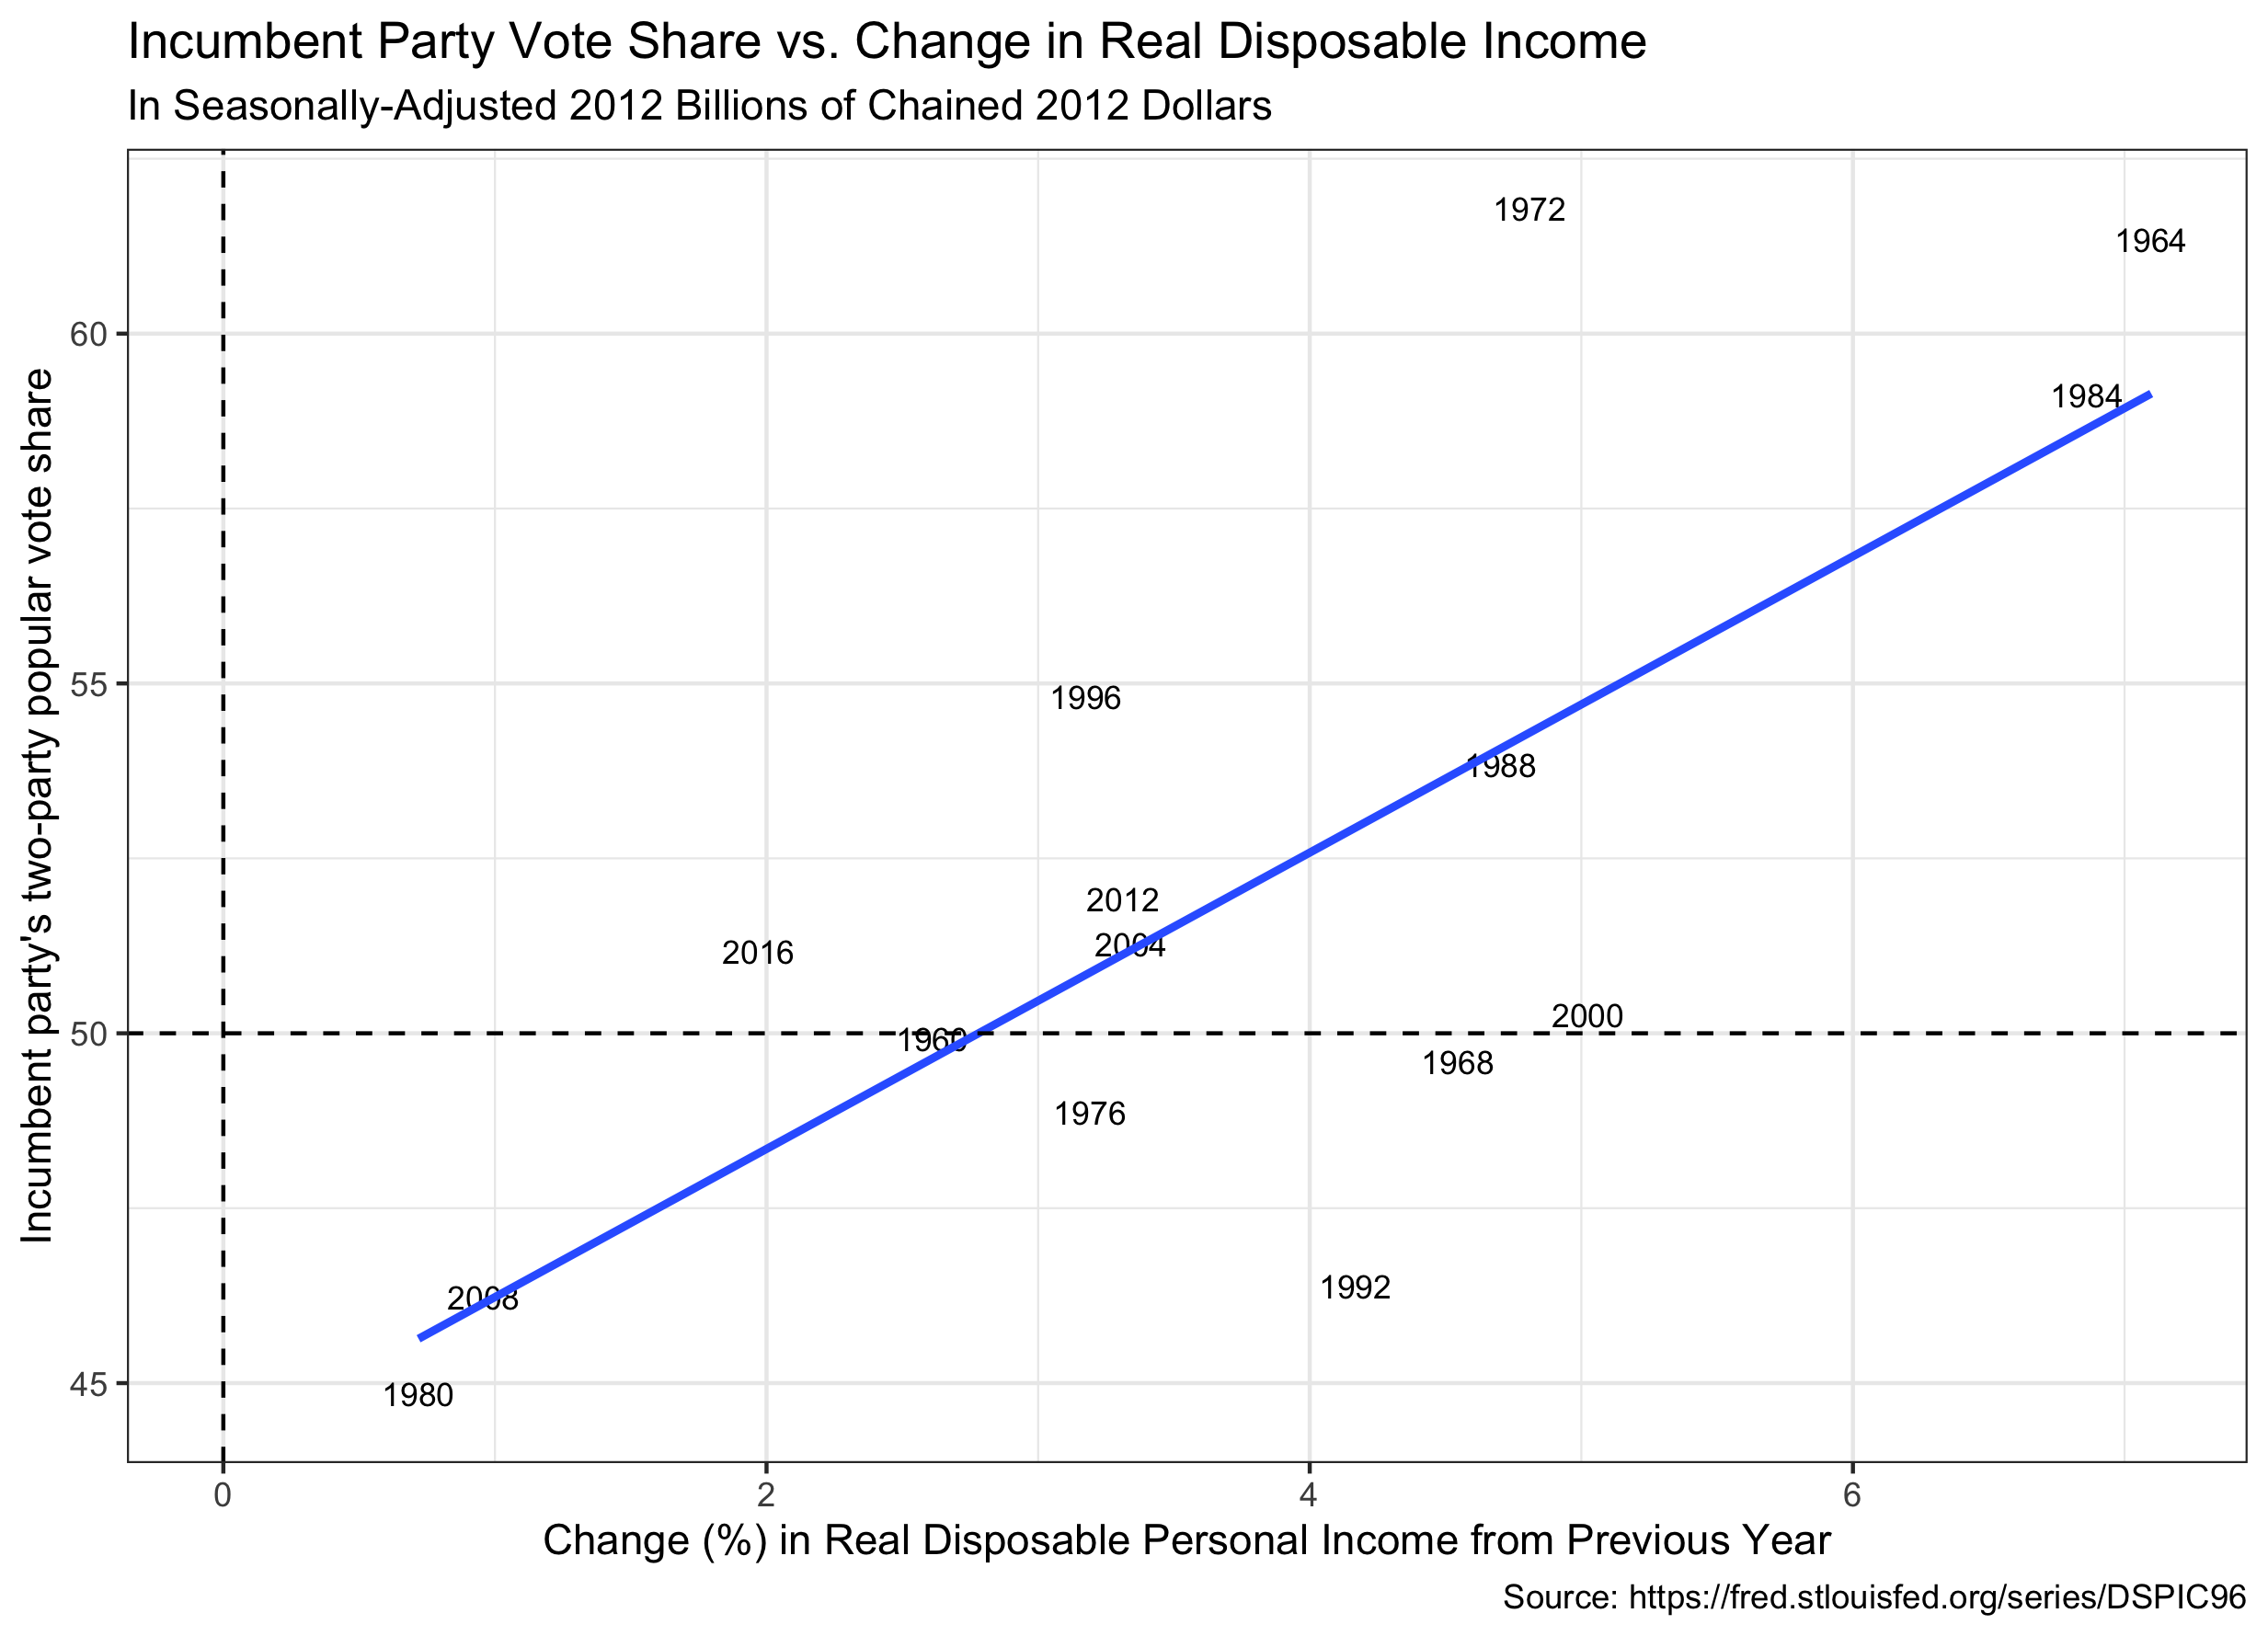
Real personal disposable income (RDPI) is an interesting economic principle to consider during the pandemic as many people’s disposable income went up even as other economic factors, like the GDP tanked. As you can see this economic variable also provides a strong predictive model:

The linear model using RDPI is pv2p_{predict} = 51.881 + 0.022 * rdpi_{2020} (FRED). The t-values for the intercept and slope in this model are 20.172 and 4.036, respectively. The mean outsampled error is 1.7. This model therefore seems to have strong predictive value.
Using the available data for RDPI in 2020 (January-July), this model predicts 58% of the two-party popular vote going to the incumbent.
Out of these four models representing the relationship between an economic variable and popular vote share, only Q2 GDP and RDPI show promise of being valuable for prediction. Using those two models, however, we find a discrepancy between predictions of 36.7 percentage points (58 - 21.3). Given the unique circumstances of 2020 it is unlikely either of those predictions will be extremely accurate.
The economic downturn of 2020 cannot be entirely attributed to Trump’s administration. Achen and Bartels discuss how voters consider an element of randomness in their evaluation of an incumbents economy (Achen and Bartels). Based on economic numbers alone it is not clear how much of the 2020 economy voters will attribute to randomness. Blame for the pandemic economy still may have a strong impact on the outcome of the election.
It is clear, however, from the examples explored above that normal predictive economic models may not be as powerful for the 2020 election as they perhaps have been in previous elections.
*A t-value close to zero would indicate that the correlation modelled might be due to random chance. An absolute t-value of > 2 is often used as a minimum in order to reject the null hypothesis, which is that there is no true correlation between the variables.
*The mean outsampled error is found by taking the average difference between the estimates created by the model and the true outcomes. This is done by leaving out 8 elections from the data, modelling it, and then comparing the subsequent predictions produced with the true values. This is repeated 1,000 times, and then the overall average is found. It is ideal to have a small out sampled error as it indicates the model fits the data well.